By JuanPa, creator of TrainingForever · Updated 5 November 2026
Monday morning. You open the calendar and see that one athlete has missed two sessions, another is finishing a demanding block and a third is starting a taper before racing. All three need a different reading, even if some curves look alike.
Metrics help you understand what has happened and decide which training makes sense right now. This guide starts with those situations. Each indicator then has its own page with examples, charts and the calculation detail at the end.
How to read the metrics in one minute
- Confirm the record. Are all activities there? Are there confirmed rest days, or is data missing?
- Look at what was done. CT, duration, discipline and session content.
- Place the trend. AC summarises the slow memory; FA responds faster; DC and PR combine both.
- Add the response. How it felt, RPE and execution of the key sessions.
- Decide the next step. Maintain, reorganise or reduce according to the goal and the person.
A single figure does not answer those five questions. A well-read chart helps you ask them.
Examples by discipline
Before you interpret CT, IR, PP, AC, FA or DC, confirm the discipline and the unit used for that session:
- Running. The primary unit is pace in min/km. Didactic example: an easy run at 5:00/km is not read the same way as intervals at 3:40/km, even if both add CT. Running power, when present, is secondary and does not replace pace.
- Cycling. The primary unit is power in watts (and PP when there are surges). Example: 200 W steady versus a ride with 300 W spikes.
- Swimming. The usual reference is CSS or pace per 100 m. Do not mix those values with bike watts or running min/km.
AC, FA and DC curves are fed by each activity's CT. Comparing weeks makes more sense when you look at the mix of disciplines, not only the total.
The map of all metrics
| Metric | Name | Practical question |
|---|---|---|
| CT | Total Load (CT) | How much load does the session summarise, and where does it come from? |
| IR | Relative Intensity (IR) | What intensity does it represent relative to threshold? |
| Weighted Power | Weighted Power (PP) | What changes when power peaks are weighted? |
| VI | Variability (VI) | How far apart are weighted and average power? |
| Grade-adjusted pace | Grade-adjusted pace | How does the reading of speed change in the mountains? |
| CSS | Critical Swim Speed (CSS) | What intensity reference do we use in swimming? |
| TRIMP | Training Impulse (TRIMP) | What load does the recorded heart rate response describe? |
| RPE | Rating of Perceived Exertion (RPE) | How demanding did the session feel? |
| Time in Zones | Time in Zones | Where were the intensity minutes distributed? |
| Aerobic Efficiency | Aerobic Efficiency | What is the relationship between output and heart rate? |
| Cardiac Drift | Cardiac Drift | How did that relationship change during the effort? |
| Best Efforts | Best Efforts | What performance was recorded for each duration? |
| AC | Chronic Adaptation (AC) | What continuity of load does the slow memory reflect? |
| FA | Acute Fatigue (FA) | How much weight does recent load carry? |
| DC | Load Differential (DC) | How do those two load memories separate? |
| PR | Performance Potential (PR) | What combination do AC and FA form in this model? |
| Progression Rate | Progression Rate | How much has AC changed in seven days? |
| Planned vs completed CT | Planned vs completed CT | What was proposed, what happened and why does it differ? |
Case 1: training with continuity, then tapering
Ana accumulates four weeks of 280, 315, 350 and 350 CT. She then reduces load to 210 and 140 CT for a planned taper.
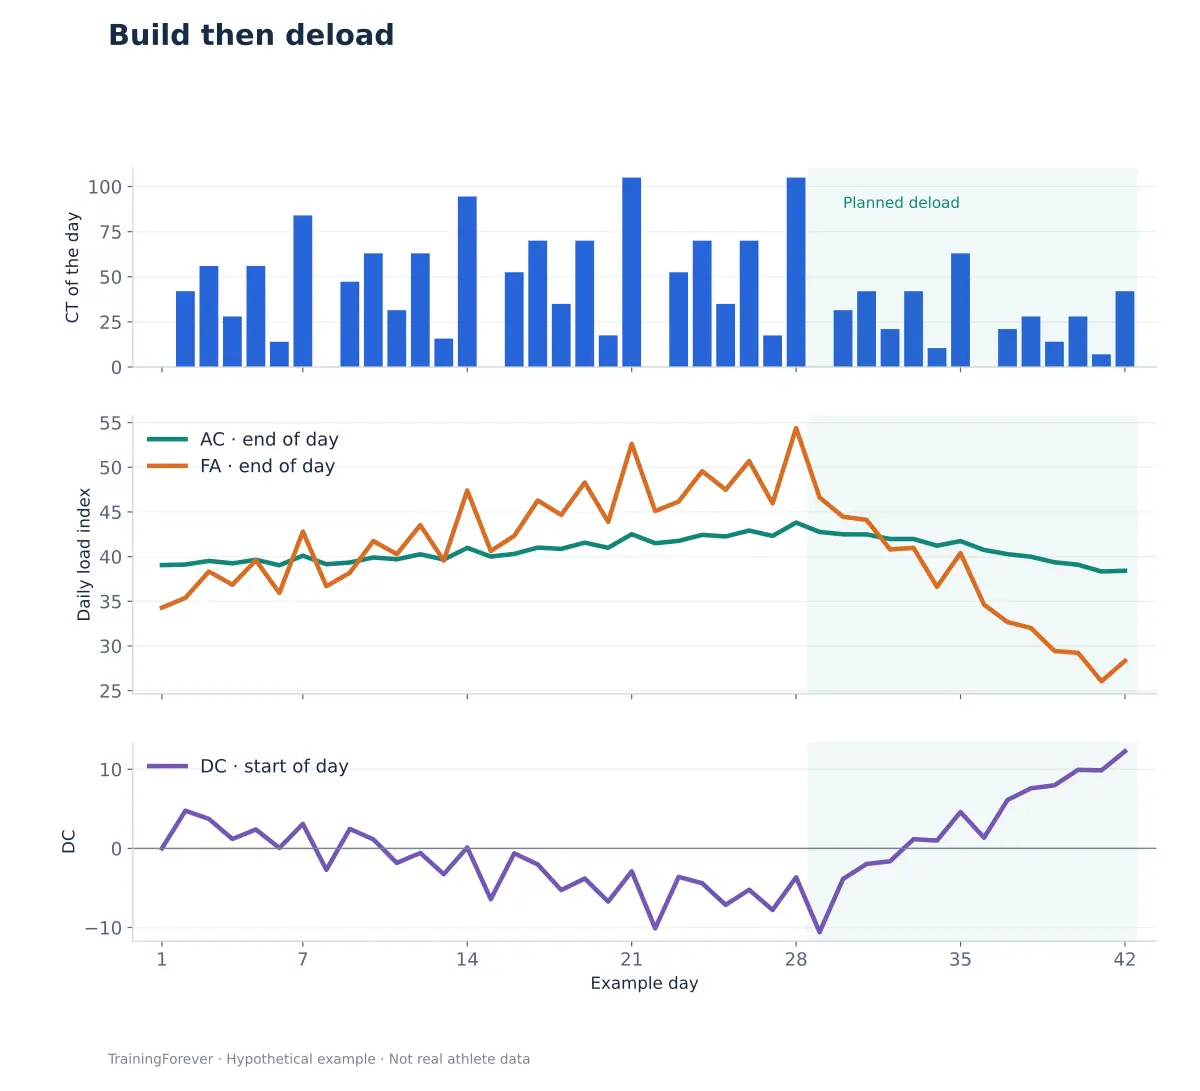
What you see: during the build, FA rises before AC. When load drops, FA falls faster and DC can turn positive.
What it means for the coach: the curve fits a change in load distribution. To assess the taper, also check whether the specific stimulus is maintained and how Ana arrives at the relevant sessions.
What to avoid: reading the small drop in AC as proven loss of fitness, or chasing the highest possible DC.
Case 2: sessions are missed over several weeks
Luis started from the same reference. After a week of 280 CT, he accumulates 180, 130 and 180. Some workouts were not done, and it has been confirmed that no files are missing.
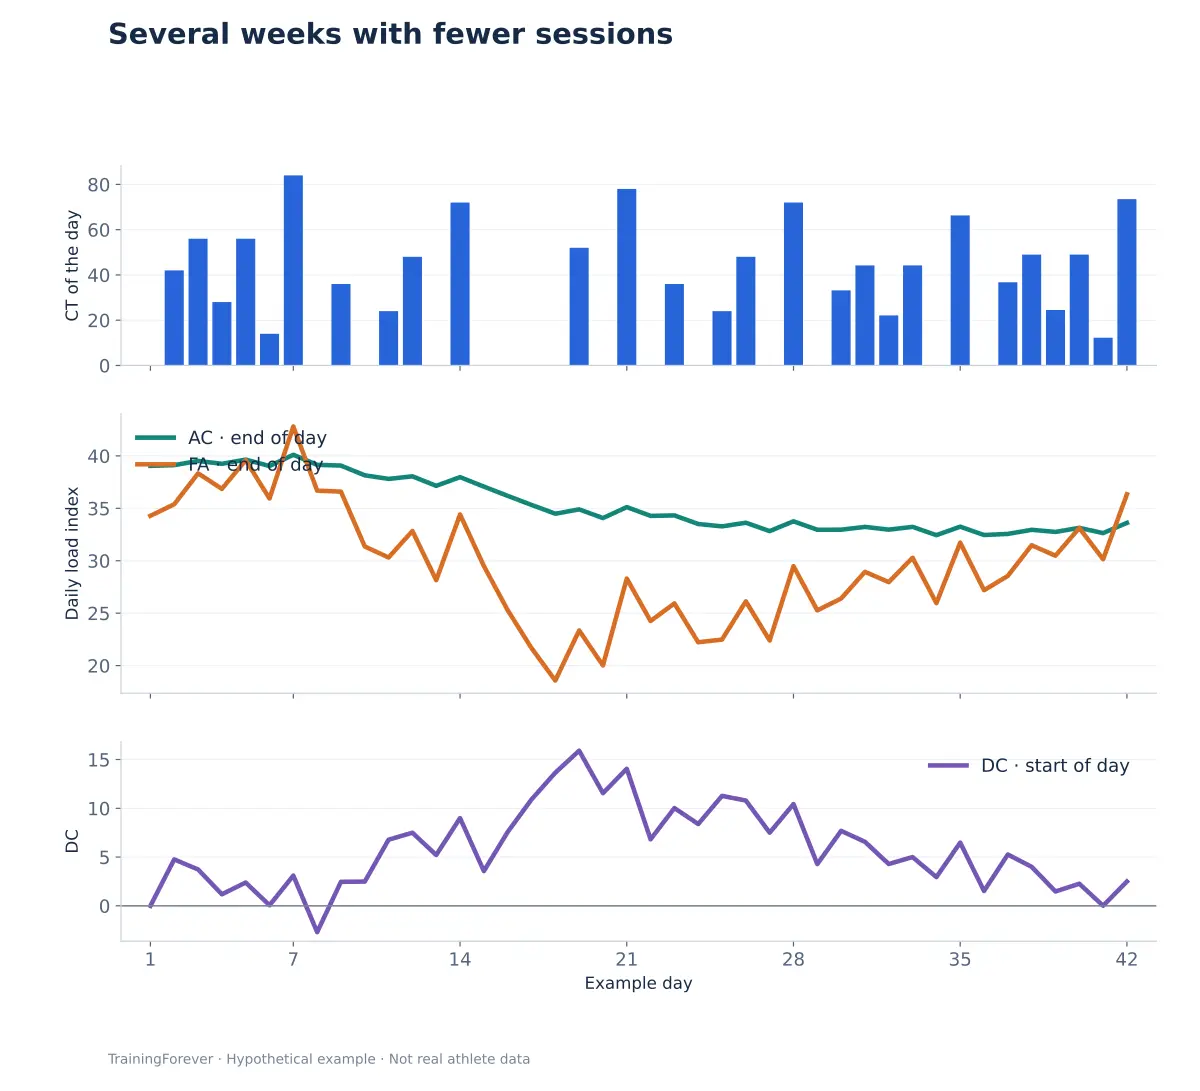
What you see: FA drops first; AC declines gradually. At the end of the fourth week, AC is around 33.8, compared with 43.8 in the build case.
What it means for the coach: find out what is preventing continuity. It may be better to reorganise three sessions that actually fit than to keep five that are never completed.
What to avoid: adding all the uncompleted load to the weekend, or announcing that the athlete is better prepared because of a positive balance.
Case 3: recent load grows a lot
Elena goes from 280 to 350, 455 and 490 weekly CT. That increase is not prescribed here: it is used to show how the calculation responds.
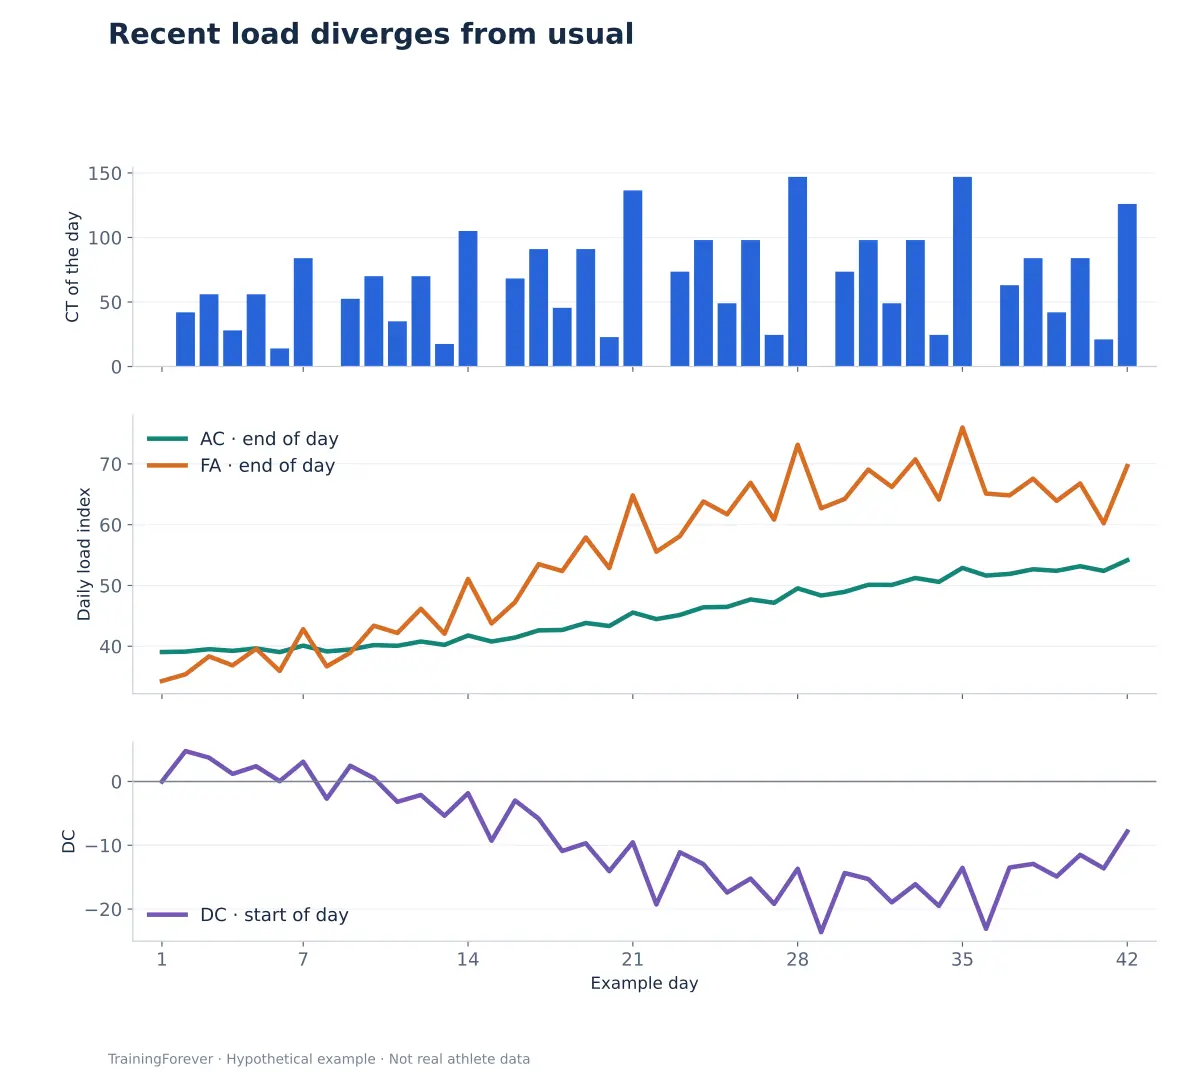
What you see: recent load separates from the slow memory. In the fourth week, closing FA is around 73.1 and AC 49.5.
What it means for the coach: confirm whether the block was deliberate and how it is being executed. If worse sensations and difficulty completing key sessions also appear, the whole picture may justify an adjustment.
What to avoid: concluding that there is injury because of a negative DC, or that a rising AC proves the training is being absorbed well.
A comparison that changes how you read PR
Performance Potential can rise during a taper and also during a break. FA falls faster than AC, and the mathematical combination increases at first.
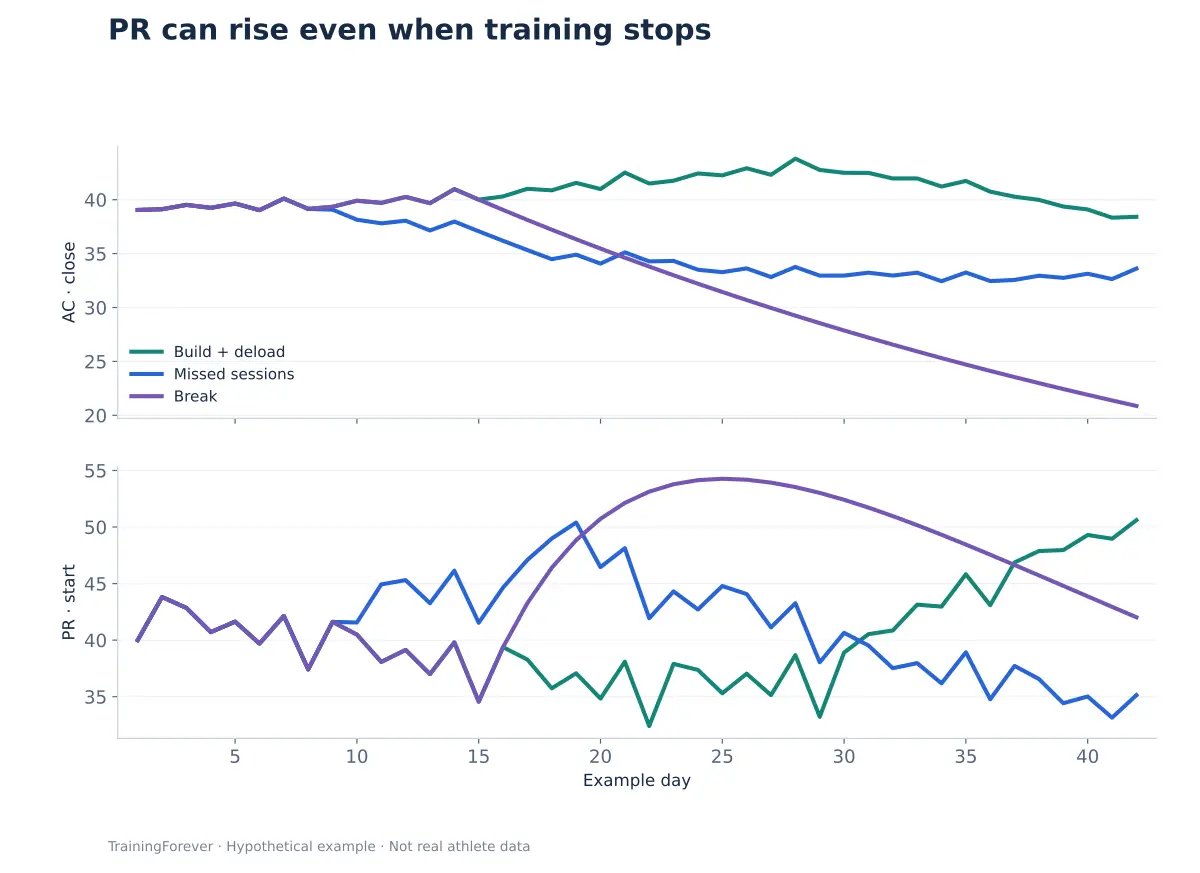
That is why a rise in PR is only useful in sporting terms when it is checked against specific preparation, key sessions and the person's response. Here you can see the full example.
How to combine load and real performance
| What you observe | What to check next |
|---|---|
| More CT and worse sensations | Content, recovery and response to the block |
| Less CT than planned | Reason for the change and pending activities |
| AC rising, best efforts curve stable | Whether there were opportunities for a comparable effort |
| Higher heart rate at the same pace | Conditions, sensor, perceived effort and context |
| Greater drift on a long run | Stability, duration, heat and early execution |
| Time in Zones different from the plan | Thresholds, signal used and actual content |
Improvement is verified by what the athlete can do in relevant conditions, not only by the amount of training accumulated.
What to compare and what to keep separate
Compare preferably the same person, with the same method, discipline and similar conditions. A CT estimated from duration contains less information than a well-recorded activity. Switching from pace to heart rate or changing a threshold can move the curves.
A confirmed rest day contributes zero completed load. An unsynced activity is pending information. And a drift that cannot be calculated should be shown as no data, not as 0%.
AC and FA come from the same CT; DC and PR are derived from them. Seeing four curves does not mean having four independent measurements of the body.
If a figure from the old weekly model appears
Some legacy help pages and views use a calculation by hours and elevation gain with the same acronyms. Their numbers are on a different scale. The weekly sum of current daily CT is not that old model either.
See the explanation of the historical weekly model and its indicators: CI, CE, Equivalent Distance, Base Total Load, recent ratio and Fatigue Budget.
Glossary of acronyms
| Acronym | Name in TrainingForever | What it summarises |
|---|---|---|
| CT | Total Load | Load of an activity or a day; one hour at threshold equals 100 CT |
| IR | Relative Intensity | Intensity of the session relative to the current threshold |
| PP | Weighted Power | Summary of power that gives more weight to changes |
| VI | Variability | Ratio between PP and average power |
| AC | Chronic Adaptation | Slow memory of CT (42 days) |
| FA | Acute Fatigue | Fast memory of CT (7 days) |
| DC | Load Differential | AC minus FA from the previous day |
| PR | Performance Potential | 2 × AC − FA from the previous day; it does not predict race times |
| CSS | Critical Swim Speed | Threshold used in swimming |
| TRIMP | Training Impulse | Load calculated from heart rate |
| RPE | Rating of Perceived Exertion | Rating of the session from 1 to 10 |
| CI / CE | Internal Load / External Load | Hours and elevation gain from the historical weekly model |
If you come from other platforms and are looking for the generic concepts of chronic load, acute load and balance, you will find the explanation in Training Load: CTL, ATL and TSB Explained. TSS, IF, NP, ATL, CTL and TSB are trademarks of TrainingPeaks.
Frequently asked questions
Is a high load good or bad?
It depends on history, content, point in the season and response. "High" needs a reference; there is no correct total for everyone.
Does a positive DC mean the athlete is ready to race?
It can reflect lower recent load, but also missed sessions or a break. Add specific preparation and current response.
Does AC measure fitness?
It summarises a memory of CT. It does not directly measure VO₂max or confirm an improvement in performance.
Should you make up the load from a missed session?
Not automatically. Review the reason and keep the plan's priorities with a workable distribution.
Does a drift below 5% prove a good aerobic base?
It is a practical guide within comparable protocols; on its own it does not identify a threshold or certify preparedness.
Applying it in TrainingForever
Start with one athlete and review their last few weeks: what was planned, what they completed and how they responded. Choose one concrete decision for the following week and then check its effect.
All cases and charts in this guide are hypothetical and reproducible. They show how the calculations behave; they are not individual recommendations or results from the scientific papers.
What this explanation is based on
- Morton RH, Fitz-Clarke JR, Banister EW (1990). Modeling human performance in running. Conceptual context of the response to training.
- Halson SL (2014). Monitoring Training Load to Understand Fatigue in Athletes. Multidimensional and individual reading of the response.
- Bosquet L et al. (2007). Effects of tapering on performance: a meta-analysis. Basis for peaking; it does not set a target PR.
The references support concepts and limits. The numerical examples on this page are educational; they are not results from those studies.