By JuanPa, creator of TrainingForever · Updated 4 November 2026
Pace or power stays steady, but heart rate keeps changing. If you need an increasingly higher cardiac response for a similar output, it's worth reviewing what is happening during that session.
Drift helps explore the stability of the response during prolonged efforts. On its own, it does not locate the aerobic threshold or identify a single cause.
What TrainingForever calculates
The product compares its efficiency indicator between two halves. When the efficiency of the second half is lower, the percentage of loss is positive.
That field decoupling is related to the cardiovascular response, but it is not a complete measurement of physiological cardiac drift: it does not directly measure stroke volume or cardiac output.
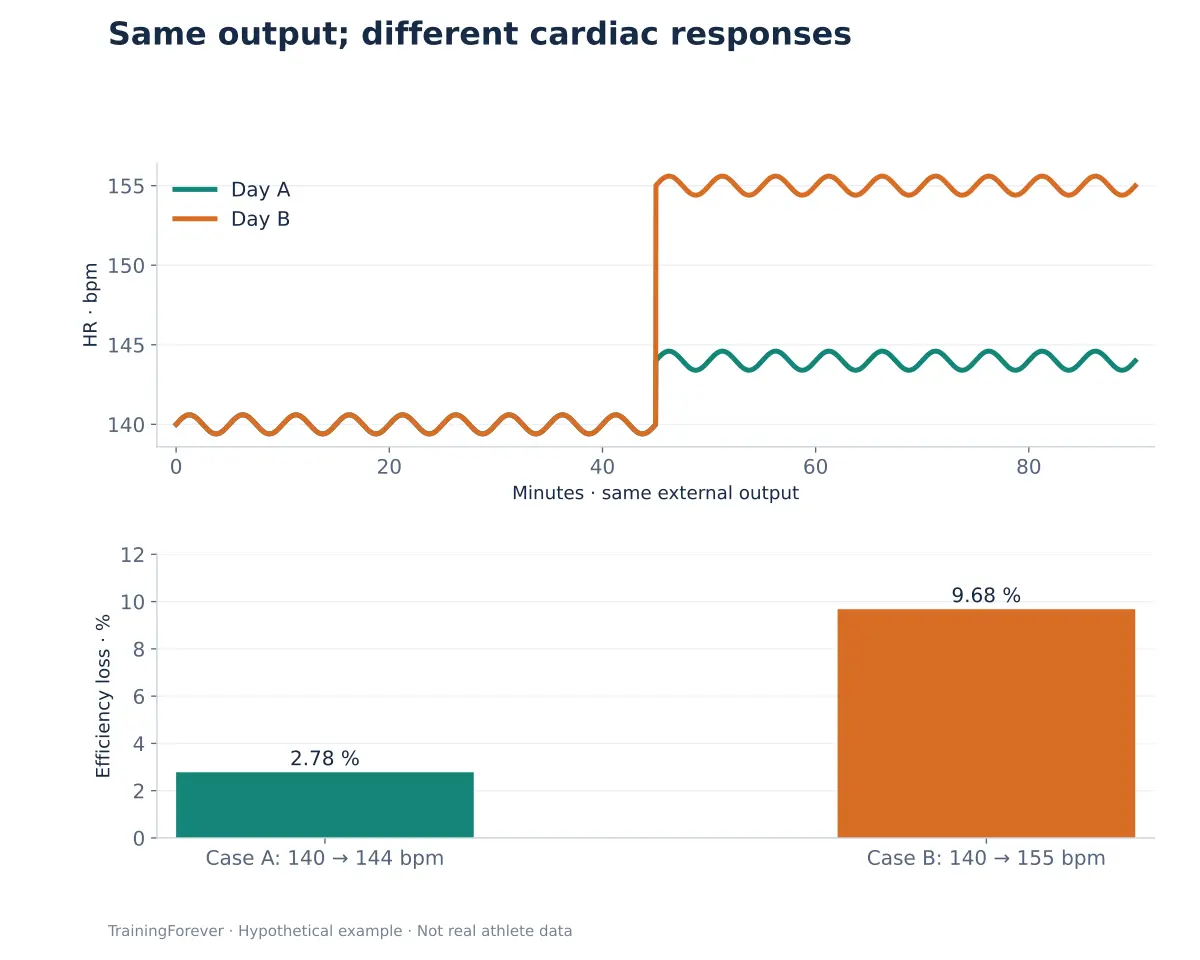
Read the example step by step
| Case | First half | Second half | Efficiency loss |
|---|---|---|---|
| A | 200 W / 140 bpm | 200 W / 144 bpm | 2.78% |
| B | 200 W / 140 bpm | 200 W / 155 bpm | 9.68% |
Case B shows a wider gap between output and cardiac response. We still don't know why: conditions, usual duration, hydration and the athlete's context are missing.
Case: a long run with a worse second half
Lucía completes a steady long run. Her heart rate rises, she reports feeling hot and she finishes with more effort than expected. The coach reviews whether she went out too fast, how long the effort lasted and whether conditions changed.
The decision may be to repeat a comparable session under more controlled conditions or to adjust how she executes it. Blaming everything on "lack of base" would rule out other explanations.
What to do with the well-known 5% reference
It can be used as a practical guide within a consistent protocol, but it is not a universal diagnostic cutoff. A 4.9% and a 5.1% do not separate two distinct biological states.
Nor is it correct to claim that exceeding 10% proves you are working above the aerobic threshold. Drift depends on conditions and duration, as well as intensity. None of those percentages, on its own, identifies a threshold.
When the comparison stops making sense
Intervals, stops, large changes in gradient or output, a faulty heart rate signal and different durations all make interpretation difficult. Before comparing percentages, check that you are comparing steady sessions.
The TrainingForever guide limits the calculation to activities longer than one hour that meet stability criteria; it does not calculate it in swimming. A missing value does not mean zero drift.
Optional calculation
Drift = 100 × (E₁ − E₂) / E₁, where E is the efficiency of each half.
With 200 W and heart rate 140→155: 100 × [1 − (200/155)/(200/140)] = 9.68%. The percentage increase in heart rate would be a different calculation, 10.71%. It is important not to confuse the two.
What it means for sport
The goal is to understand how a relevant effort for the race is sustained. Better stability under comparable conditions provides context; demonstrating performance improvement also requires observing what the athlete can do.
What this explanation is based on
- Coyle EF, González-Alonso J (2001). Cardiovascular drift during prolonged exercise: new perspectives. Explains the physiology of the prolonged cardiovascular response.
- Maunder E et al. (2021). The Importance of Durability in the Physiological Profiling of Endurance Athletes. Provides context on the deterioration of characteristics during long efforts; it does not establish a universal drift cutoff.
The references support concepts and limits. The numerical examples on this page are educational; they are not results from those studies.