By JuanPa, creator of TrainingForever · Updated 4 November 2026
200 watts can be comfortable work for one person and near-threshold intensity for another. IR places the session's output in relation to an individual reference.
The comparison starts with the athlete and their current threshold. That way you can interpret whether the effort matched the goal you had set.
What the number means
An IR of 1 means the signal used matches the athlete's reference threshold. An IR of 0.80 sits below it; one of 1.05 sits above. This does not mean that working at 0.80 is "80% of maximum", nor does it determine how long that person can sustain it.
What's more, not all sources describe the same thing. Power, speed and heart rate are different signals; their ratios should not be mixed as if they were a single physiological measure.
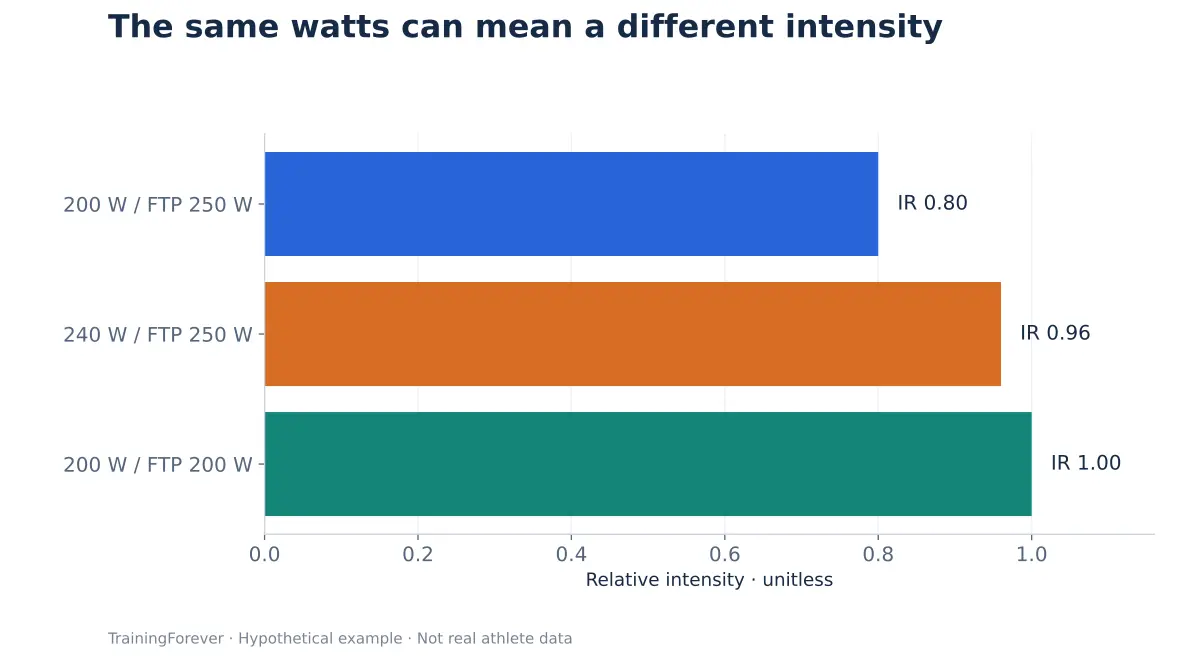
| Representative power | FTP | IR |
|---|---|---|
| 200 W | 250 W | 0.80 |
| 240 W | 250 W | 0.96 |
| 200 W | 200 W | 1.00 |
Case: the easy ride that looks too intense
Andrés completes his usual ride. IR shows up higher than in other weeks, but his watts and how he feels are similar.
First check: has the configured FTP or the power source changed? If the denominator drops, IR rises without any need for the work done to increase. An outdated threshold can also throw off CT and the curves that depend on it.
Updating a threshold should reflect new training information. Changing it just to make a chart look nicer destroys the usefulness of the comparison.
How to read it in running
For paces expressed in minutes per kilometre, you have to think in terms of speed. If the threshold is 4:00/km and the session is equivalent to 5:00/km, the speed ratio is 4/5 = 0.80.
Dividing 5 by 4 would give the opposite interpretation: it would look as though running slower increases intensity. On gradients, it also matters whether grade-adjusted pace or unadjusted speed is being used.
How it helps with planning
An easy ride can be extended and accumulate CT without getting close to threshold. An interval workout can include minutes above threshold and very easy recoveries. A summarized IR cannot reconstruct all those changes.
That's why, when you review a quality session, pair it with the blocks, time in zones and how the repetitions were executed. Two sessions with a similar summary may have produced very different experiences.
What to check before drawing a conclusion
- That the threshold belongs to the right discipline and the right date.
- That the signal is reliable and the method did not change between sessions.
- That the summary isn't hiding high variability.
- That the session's goal allows that combination of duration and intensity.
Calculation and limits
The logic is IR = representative output / threshold. In cycling, Weighted Power (PP) may come into play; in running, grade-adjusted pace; in swimming, CSS. The heart-rate branch has its own limitations.
The software's numerical limits exist to contain improbable values. They are not the boundaries of human capacity. If there is no measured intensity, a load estimate should not be presented as an observed IR either.
What this explanation is based on
- Joyner MJ, Coyle EF (2008). Endurance exercise performance: the physiology of champions. Performance has several determinants; a single ratio does not sum them up.
The references support concepts and limits. The numerical examples on this page are for teaching purposes; they are not results from those studies.