Zone 2 training is the easy aerobic work you can hold and repeat the next day. In running, trail, cycling and triathlon it is the base of the week, not a reward for having gone easy. This page says what that zone is, how to calculate it from heart rate, power, pace or the talk test, how much volume makes sense, and which mistakes turn it into something else. The full five-zone calculation, with the worked example, stays in the heart-rate zone guide: that is where a zone calculator search lands. Here we stay on zone 2.
What zone 2 training is
In the five-zone convention that guide uses, zone 2 is the aerobic endurance band: 60–70% of maximum heart rate, or the same percentage of heart-rate reserve if you use Karvonen. It is not a threshold measured in a lab. It is a cut of that model for talking about an effort that is easy, steady and repeatable.
The feeling matches that. You can speak in full sentences. Breathing is up, but it does not break. You do not need to lie down afterwards, and a similar session still fits the next day. If the run only “works” when you push, or if the legs cannot repeat it tomorrow, that session was not zone 2, even when the average heart rate landed inside the range.
The first threshold (the point where lactate starts to rise above baseline) is the physiological ceiling of this easy work. Below it you can talk and keep going. Between the first and the second threshold the effort is already different: short phrases, a higher cost, less room to repeat. How those two points differ is in lactate threshold. The procedure for a lactate test is in the lactate-test guide.
What it is for in running, trail, cycling and triathlon
It is for stacking aerobic time without making the week useless. It does not replace threshold work or VO2max intervals. It leaves them room.
- Running. An easy run on flat ground is the cleanest place to read the zone: pace in min/km and heart rate together. A run that starts in the band and finishes at race pace has changed stimulus, even if the calendar said “easy”.
- Trail. Pace in min/km moves with the gradient. Hiking uphill can be zone 2, and running the descent can leave it. Heart rate, the talk test and perceived effort hold up better than chasing a road pace. Grade-adjusted pace helps you compare climbs and descents. It does not turn a hill into flat ground.
- Cycling. Power says what you are producing right now. Heart rate lags. A short climb can sit above zone 2 power while heart rate is still inside the band. On the flat, holding watts clearly below threshold, with room to talk, is the useful reading. Weighted power (PP) shows whether the file was uneven: lots of spikes and a friendly average are not a zone 2 session.
- Triathlon. Each sport has its own anchor. Minutes in swimming zone 2, set against pace per 100 m or critical speed, are not the same minutes of running or riding. An easy brick is planned so both parts stay easy, not so you can “use the chance” and lift the second one.
Five-zone zone 2 is not Seiler’s zone 2
Seiler and Kjerland (2006) split the training of 11 nationally competitive junior cross-country skiers with two ventilatory thresholds. Zone 1: below the first. Zone 2: between the two. Zone 3: above the second. Across 318 endurance sessions in 32 days, the heart-rate split was 75 ± 3% in zone 1, 8 ± 3% in zone 2 and 17 ± 4% in zone 3. By session perceived effort, 76 ± 4%, 6 ± 5% and 18 ± 7%. In 60 sessions with lactate, 71% were at or below 2.0 mmol/L, 7% between 2 and 4 mmol/L, and 22% above 4 mmol/L. Almost all of the easy volume sits in their zone 1. Their zone 2, the band between thresholds, is the one they barely use.
Seiler (2010) sums up descriptive studies of national or international endurance athletes who train 10 to 13 times a week. About 80% of sessions are at low intensity (the abstract places that intensity at 2 mmol/L of lactate) and about 20% are dominated by high-intensity work, such as intervals around 90% of VO2max. In athletes who are already highly trained, that review does not see convincing evidence that loading the week with more intervals improves long-term performance.
The practical consequence is about the name, not a percentage to copy. When a recreational runner says “I do a lot of zone 2”, they usually mean the easy band of a five-zone model: below the first threshold, conversation still possible. That looks like Seiler’s zone 1, not his zone 2. Doing “lots of zone 2” in Seiler’s sense means lots of time between thresholds, exactly the band those skiers hardly touched. Time in zones is only comparable inside the same model and the same signal. An 80% share in Z2 of a five-zone file is not Seiler’s 80% of sessions.
Those studies describe athletes who race and train many times a week. They are not an hour prescription for someone who goes out three days.
How to calculate zone 2
Pick one anchor and do not swap it mid-week. The full formulas, when to use each one, and the five-zone table are in the heart-rate zone guide. Below, only zone 2 is worked out.
From heart rate
You need two numbers, and it is worth not inventing them. Maximum heart rate estimated as 220 minus age is a rough starting point. A measured max, from a test or the end of a short race run hard, looks more like that person. Resting heart rate is taken on several mornings, before you get up, and you use the average. If you do not have it yet, stay with a percentage of max and move to Karvonen once you do.
In the guide’s five-zone convention:
- Percentage of HRmax. Zone 2 = HRmax × 0.60 up to HRmax × 0.70.
- Karvonen, or heart-rate reserve (Karvonen, Kentala and Mustala, 1957). First the reserve: HRmax − resting HR. Then target HR = resting HR + (reserve × percentage). Zone 2 uses 60–70% of that reserve, not 60–70% of max.
- From threshold. If you know the heart rate at the first threshold, that point is the ceiling of easy work, not a percentage of a formula. The second threshold (or a field estimate, such as the last 20 minutes of a 30-minute test) keeps easy work from being confused with threshold work. The exact cuts as a percentage of threshold belong to the model you chose.
The same heart, the first two methods, zone 2 only. This is the zone 2 row of the guide’s example: HRmax 190 bpm and resting HR 50 bpm. Reserve is 140 bpm. It is not a result from the studies above.
| Method | What you multiply | Zone 2 at 60–70% |
|---|---|---|
| % of HRmax | 190 bpm | 114–133 bpm |
| Karvonen | A reserve of 140 bpm, plus rest | 134–148 bpm |
Karvonen comes out higher because it adds rest: 50 + (140 × 0.60) = 134, and 50 + (140 × 0.70) = 148. The two numbers are not interchangeable. If the watch is on one method and the plan on the other, the “easy” session moves. The zone edges meet in the guide’s full table.
From power
On the bike, and in running if there is a power meter, endurance zone 2 is the band of your model that sits clearly below threshold and below tempo. The usual anchor is FTP or threshold power: those are generic terms, and the percentages come from the model you use, not from this page. A friendly average wattage with lots of spikes does not count as zone 2. Weighted power shows that.
How heart rate and watts live together, without being forced to match every second, is in heart-rate and power zones.
From pace
Zone 2 pace does not come from a universal min/km formula. It comes from steady sessions done inside the heart-rate or power band you have already set: you note the average pace of those stretches, and that table belongs to that person until fitness changes. On the trail, a flat min/km does not survive the gradient. In the pool, pace is per 100 m, anchored to critical speed, and it is not copied from the run.
Talk test and perceived effort
Foster and colleagues (2008) tested the link between the talk test and the ventilatory threshold. When that threshold moved (blood donation, a training period) and when intensity was placed above and below it, the ability to speak tracked the threshold well enough to prescribe exercise. The error they describe leans toward passing the test when intensity is already above the threshold: being able to say a sentence does not, by itself, prove you are still below it.
A coach uses it like this. Full sentences, not trimmed so you can answer: you are still on the easy side. Broken sentences: you have moved into the band between thresholds, or past it. It does not turn heart rate into a number. It helps on a hot day, on a climb, or when the sensor fails.
Perceived effort closes the same reading. In TrainingForever, session RPE runs from 1 to 10. Zone 2 done well usually sits in the low part of what that person records on easy runs. You compare them with themselves, not with someone else’s 3. How to ask the question is in the guide to perceived effort (RPE).
How much to do each week
There is no hour figure that fits everyone. Seiler’s 80% (2010) is a split of sessions in athletes who already train 10 to 13 times a week, and most of that easy volume is his zone 1, below the first threshold. Copying “80% of my four days” as if it were the same thing mixes up the zone’s name and the kind of athlete.
What a coach decides — and this is a coach’s judgment from those findings, not a protocol from the papers:
- The key session of the week comes first. Zone 2 fills the rest of the time that person can recover.
- Each easy outing has to be repeatable. If the next quality session falls apart, the easy volume was too much, or it was not easy.
- Someone who trains three days does not need to fill the calendar to look like a skier who trains daily. Fewer sessions, still easy, teach more than four days half-pressed.
- Recent load outranks a tidy percentage. If Acute Fatigue (FA) runs ahead of Chronic Adaptation (AC), Load Differential (DC) shows it. Adding another run “because it is zone 2” is still load.
Typical mistakes
- Going too hard. The group, ego or the hills push the run into the band between thresholds. In Seiler’s model that is his zone 2, the one that took the least time in those skiers. In a five-zone model, the file stops being Z2. Time in zones shows it when the model and the signal stay the same from week to week.
- Reading the average and calling it done. Twenty minutes too high and twenty too low can average inside the range. The session was not zone 2.
- Ignoring cardiac drift. Coyle and González-Alonso (2001) describe cardiovascular drift in prolonged moderate exercise: from about 10–20 minutes, stroke volume falls and heart rate rises in parallel. Dehydration makes it larger. Pace or watts can stay the same while heart rate leaves the band. How TrainingForever reads the two halves of a long effort is in cardiac drift. A lone percentage does not name the cause: heat, gradient, too little to drink, or a pace that was already high.
- Chasing heart rate at all costs. In heat or fatigue, slowing until the number comes back can leave a session so short or so broken that it no longer stacks what you wanted. The talk test and RPE say whether you are still on the stimulus. Heart rate, that day, is the signal that moved.
- Mixing anchors. Monday as a percentage of max, Wednesday on Karvonen, Saturday on the pace from an old test. Zone 2 changes number and the athlete does not know which one to follow.
- Treating 220 minus age as a measured max. If the formula sits too low or too high, the whole band shifts. The zone guide compares that estimate with a measured max.
How a coach plans and monitors it
First the model goes on the athlete profile: max, resting heart rate if the calculation uses it, threshold if there is one, and the zones that come from that choice. When fitness changes, you repeat the same test. You do not switch formula.
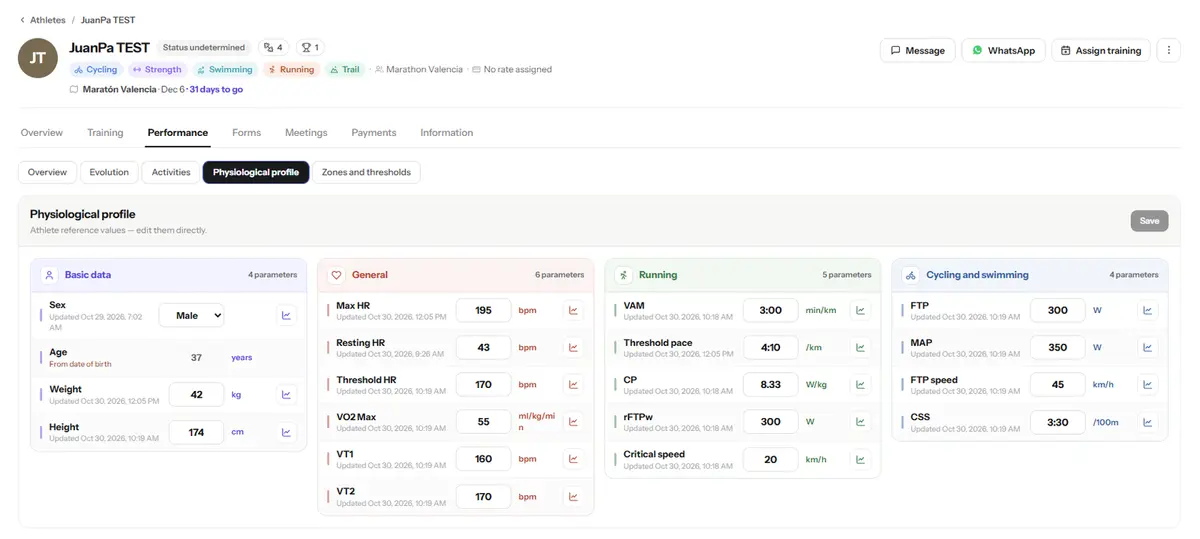
The session is written with a range and a talk-test check, not only with an average heart rate. On the flat it can carry pace. On the bike, power. On the trail, heart rate or RPE, and room to walk the climbs that leave the band. The coach exports that session to the watch: Garmin, Polar, Suunto, Apple Watch and Coros. Strava can sit alongside if the athlete already uses it. It is not required to plan the zone or to read the file.
After the outing you look at whether the intention and the file match. Time in zones says how many minutes fell in the band. Relative intensity (IR) says whether the whole thing was actually easy. Total Load (CT) says what that session weighed in the week. On the bike, PP gives away the spikes. On a long effort, drift says whether heart rate left while output held. RPE, on a 1-to-10 scale, says how it felt.
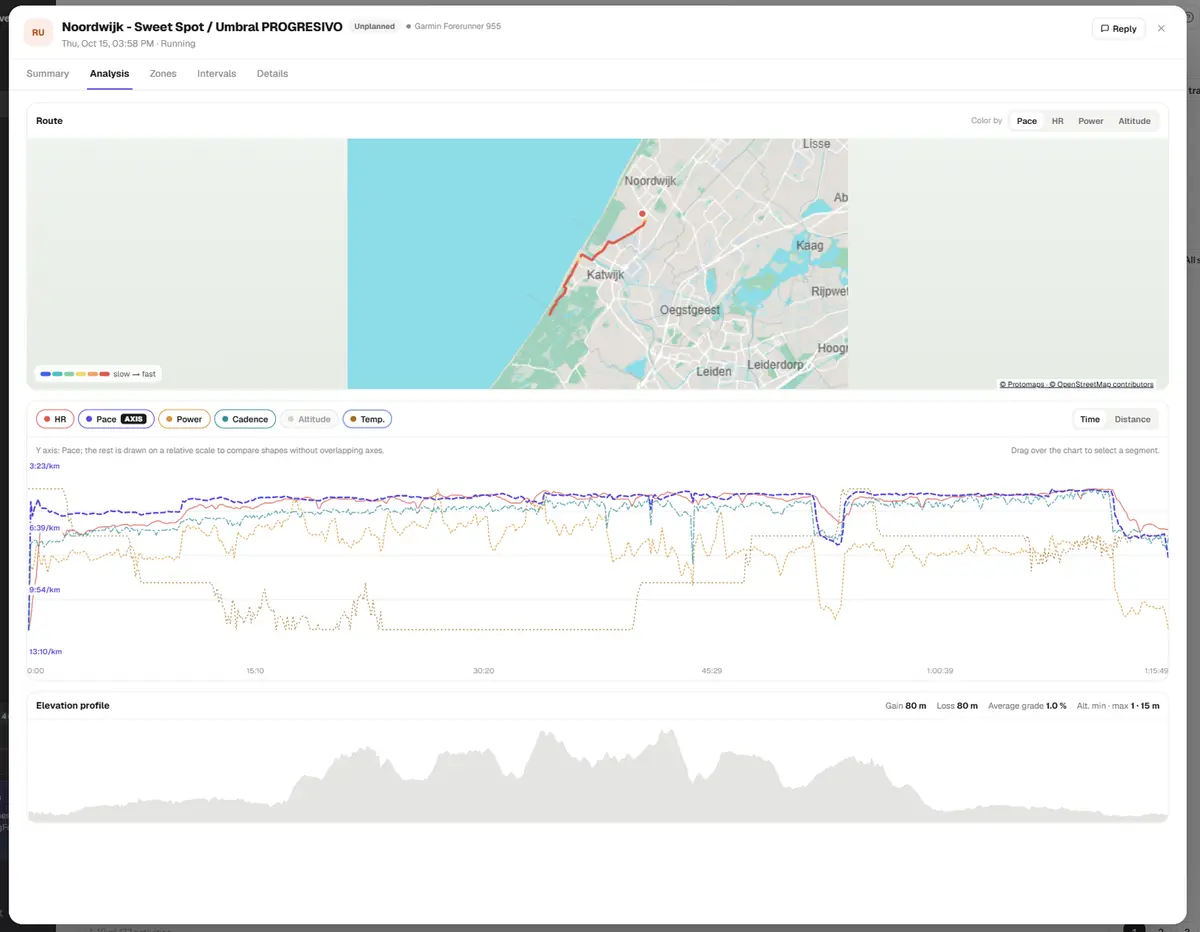
That decides the next week. If zone 2 comes out easy, RPE is the usual one and FA does not jump, volume can stay or rise modestly. If heart rate drifts, RPE climbs, or the next day’s key session falls over, you shorten the duration or lower the ceiling before adding another day. The names of these metrics and how to read them together are in the TrainingForever metrics guide.
What a coach says
“Zone 2 goes wrong when the athlete uses it to prove they are fit. If they cannot repeat a similar session the next day, that run was not zone 2, even if the average heart rate stayed inside the range.” — Marc Bañuls, online running and trail coach
Frequently asked questions
What is zone 2 training?
It is easy, repeatable aerobic work. In the five-zone convention of the heart-rate zone guide, it is 60–70% of HRmax, or the same percentage of heart-rate reserve with Karvonen. By feel, you can speak in full sentences and repeat a similar session the next day. It is not zone 2 in Seiler’s three-zone model: that band sits between thresholds.
How do I calculate my zone 2?
With an HRmax of 190 bpm, 60–70% is 114–133 bpm. If resting HR is 50 bpm, Karvonen gives 134–148 bpm: 50 plus 60–70% of the 140 bpm reserve. That is the zone 2 row of the guide’s example, not a lab threshold. If you know the first threshold, that point is the ceiling of easy work. Power and pace come from the model and from that person’s steady sessions. The five-zone table is in the heart-rate zone guide.
Is the zone 2 I train Seiler’s zone 2?
Almost never. In Seiler and Kjerland (2006), zone 1 is below the first ventilatory threshold, zone 2 is between thresholds and zone 3 is above the second. Across 318 endurance sessions from 11 junior skiers, heart rate split 75 ± 3% in zone 1, 8 ± 3% in zone 2 and 17 ± 4% in zone 3. The easy work a runner means by zone 2 looks like zone 1 in that model.
How much zone 2 should you do each week?
Seiler (2010) describes, in athletes who train 10 to 13 times a week, about 80% of sessions at low intensity and about 20% dominated by high-intensity work. It is not an hour quota for every calendar. The coach leaves room for the key session and fills the rest with easy work that can be repeated, watching Total Load, Acute Fatigue, Chronic Adaptation and Load Differential.
Why does heart rate rise if pace does not change?
In prolonged moderate exercise, Coyle and González-Alonso (2001) describe a drift: from about 10–20 minutes stroke volume falls and heart rate rises, and dehydration makes it larger. You can stay at the same pace or the same watts and leave the band. Look at the two halves, the heat and what was drunk before deciding the zone was calculated wrong. How TrainingForever reads it is in the cardiac-drift article.
Sources and methodology
- Seiler KS, Kjerland GØ. Quantifying training intensity distribution in elite endurance athletes: is there evidence for an “optimal” distribution? Scandinavian Journal of Medicine & Science in Sports. 2006;16(1):49-56. doi:10.1111/j.1600-0838.2004.00418.x
- Seiler S. What is best practice for training intensity and duration distribution in endurance athletes? International Journal of Sports Physiology and Performance. 2010;5(3):276-291. doi:10.1123/ijspp.5.3.276
- Foster C, Porcari JP, Anderson J, Paulson M, Smaczny D, Webber H, Doberstein ST, Udermann B. The talk test as a marker of exercise training intensity. Journal of Cardiopulmonary Rehabilitation and Prevention. 2008;28(1):24-30. doi:10.1097/01.HCR.0000311504.41775.78
- Coyle EF, González-Alonso J. Cardiovascular drift during prolonged exercise: new perspectives. Exercise and Sport Sciences Reviews. 2001;29(2):88-92. doi:10.1097/00003677-200104000-00009
- Karvonen MJ, Kentala E, Mustala O. The effects of training on heart rate; a longitudinal study. Annales Medicinae Experimentalis et Biologiae Fenniae. 1957;35(3):307-315. pubmed.ncbi.nlm.nih.gov/13470504
Figures from Seiler and Kjerland (2006) — 11 men, 32 days, 318 endurance sessions, heart-rate split 75 ± 3%, 8 ± 3% and 17 ± 4%, session RPE 76 ± 4%, 6 ± 5% and 18 ± 7%, and lactate in 60 sessions: 71% at or below 2.0 mmol/L, 7% between 2 and 4, 22% above 4 — come from the Crossref abstract of the first DOI. Seiler (2010) abstract: athletes training 10 to 13 times a week, about 80% of sessions at low intensity placed at 2 mmol/L of lactate, about 20% dominated by high intensity (intervals around 90% of VO2max), and no convincing evidence, in already highly trained athletes, that more intervals improve long-term performance. Foster et al. (2008): the talk test tracks the ventilatory threshold, with a bias toward passing it when intensity is already above. Coyle and González-Alonso (2001): stroke volume falls and heart rate rises from about 10–20 minutes, made larger by dehydration. Checked on 19 November 2026. The 60–70% band is the five-zone convention of this site’s heart-rate zone guide, not a result of those studies. The 190/50 example is that guide’s zone 2 row. Volume decisions are a coach’s judgment. Session RPE on a 1-to-10 scale, the zone profile, exporting the session to Garmin, Polar, Suunto, Apple Watch and Coros, and the metrics named here are features of the current TrainingForever site.