By JuanPa, creator of TrainingForever · Updated 4 November 2026
After several demanding sessions, recent load weighs more. FA reflects that fast part of the CT story and helps you see changes that the slow AC curve smooths out.
FA is a recent-load index. Even though the product calls it Acute Fatigue, it does not directly measure tiredness, muscle damage or full recovery.
How it moves
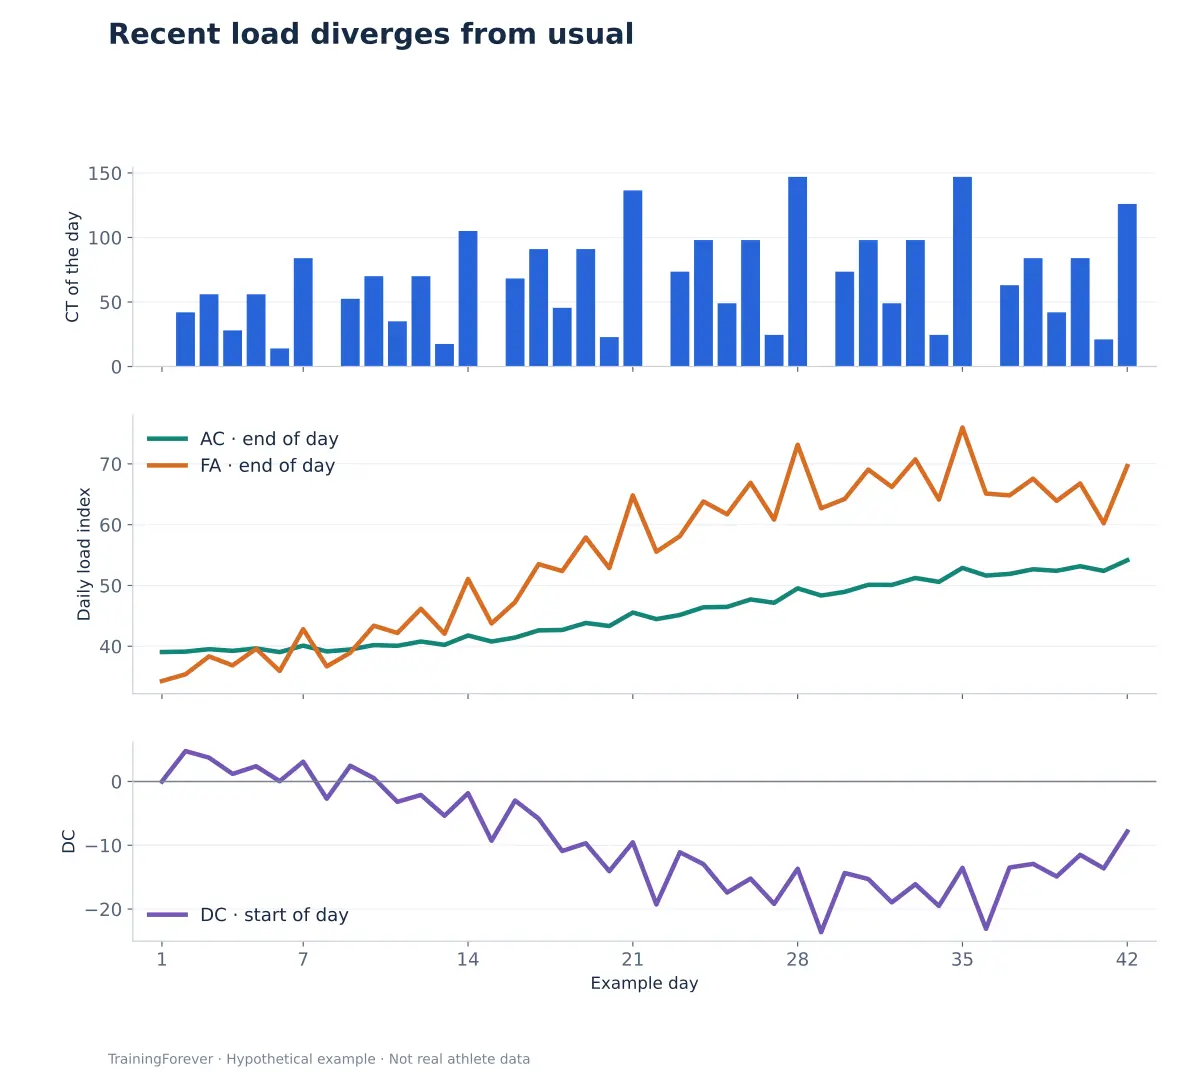
In the fourth week of the example, closing FA is around 73.1 and AC 49.5. That gap describes a high recent load relative to the slow memory. The chart does not determine whether the athlete tolerates it well.
Case: a demanding week that was planned
Raúl completes a block with more time and a long run. FA rises, but the key sessions go as intended and how he feels is consistent with the planned work.
The rise may fit the plan. It is worth checking how he responds and what taper follows; don't automatically remove the stimulus just because a curve has gone up.
Case: high FA and signals that call for adjustment
Now add that Raúl reports heavy legs, sleeps worse and can't hold his usual intensities. That context changes the decision. The curve provides one piece, while execution and conversation show how he is living the load.
The coach can reduce the demand or reorganise the sessions. The aim is to respond to the whole picture, not to get FA down to a fixed number.
And if FA is low but they feel bad
They may have trained little and still be affected by stress, insufficient sleep or niggles. Those factors don't feed directly into the CT filter. A low FA does not certify readiness for an intense session.
An activity or a poorly logged strength session may also be missing. Check coverage before assuming you know their whole week.
A reading in three questions
| Question | What it is for |
|---|---|
| Which sessions explain the rise? | Identifying the real stimulus |
| How are they responding? | Adding information the curve doesn't measure |
| What is needed in the coming days? | Linking the adjustment to the goal |
Changing FA should never be an end in itself. An easy week before a race and a week with three missed sessions can lower the index for different reasons.
Calculation and comparison with AC
FA_today = FA_yesterday + (CT_today − FA_yesterday) / 7.
The 1/7 coefficient makes it respond faster than AC. It does not mean everyone recovers in seven days. It is another memory of the same CT, not a second sensor of the body.
In the historical weekly model, FA had a different definition. To compare figures, confirm they come from the daily Evolución model.
What it gives the coach
It helps detect recent load changes and choose where to look more closely. Its value grows when it is contrasted with the person who has done the sessions.
What this explanation is based on
- Halson SL (2014). Monitoring Training Load to Understand Fatigue in Athletes. There is no single definitive marker of fatigue.
The references support concepts and limits. The numerical examples on this page are educational; they are not results from those studies.