By JuanPa, creator of TrainingForever · Updated 4 November 2026
Two athletes finish an hour of training. One has ridden comfortably; the other has accumulated work near threshold. The time matches, but the stimulus doesn't. CT tries to sum up that difference in one manageable figure.
For the coach, the question is whether the load performed fits the purpose of the session and what that person has been doing. A high figure doesn't make a session better.
What CT represents
It's a load unit modelled from duration and intensity. The TrainingForever reference is one hour at threshold: 100 CT. It lets you add up activities, review weeks and feed the evolution curves.
It doesn't express calories, equivalent kilometres or muscle damage. Nor does it automatically turn swimming, cycling, running and strength into interchangeable stimuli.
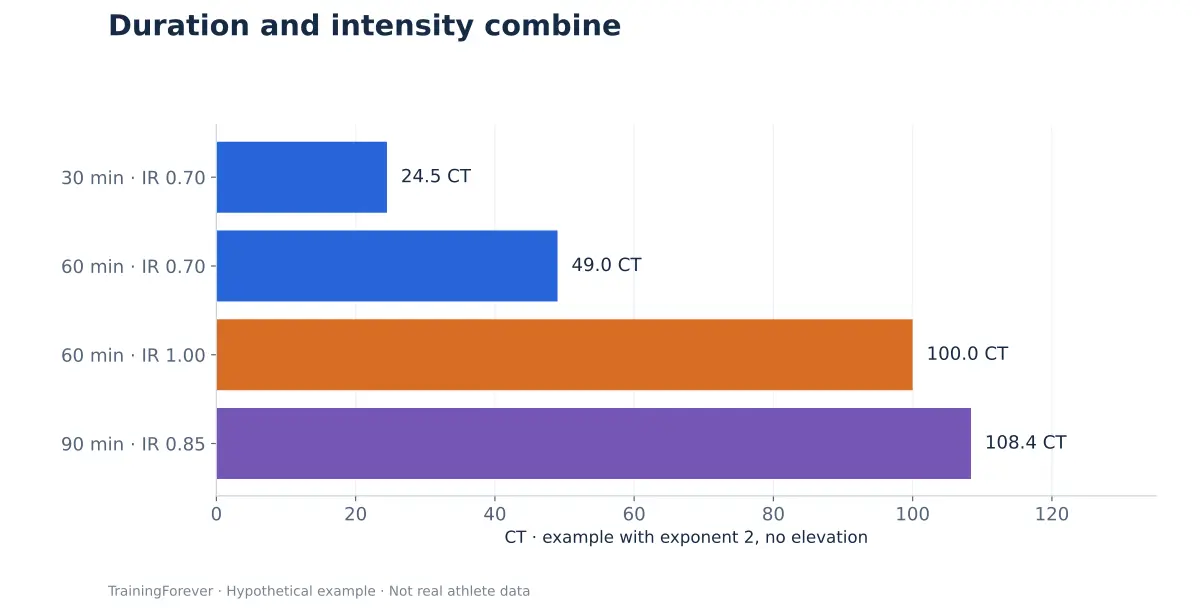
A chart to understand the role of intensity
| Example session | CT | What to ask |
|---|---|---|
| 30 min at IR 0.70 | 24.5 | Was this the planned short easy run? |
| 60 min at IR 0.70 | 49.0 | Was the intended intensity maintained? |
| 60 min at IR 1.00 | 100.0 | Was this a planned demanding session? |
| 90 min at IR 0.85 | 108.4 | Does the duration explain the high load? |
The figures are operations of the model, not a recipe for prescribing those sessions.
How to read an unexpectedly high CT
Laura had a 60-minute easy run and ended up running 85. The actual CT exceeds the planned one. Before changing her thresholds, check the time: she has done more training.
If duration and route match, look at the intensity, the sensor and the threshold used. The source of the calculation also matters: switching from pace to heart rate can change the figure without the training having become proportionally harder.
On trail there's another question: has the gradient been taken into account? Depending on the available data, the model can adjust speed or resort to an elevation-gain correction. The same effect shouldn't be added twice.
And if CT is low
A deload week may need less CT. A week with missed sessions will also have less CT, but it calls for a different conversation. The total only describes part of what happened.
If an activity is missing, confirm whether there was rest or a syncing problem. Not interpreting a missing file as confirmed rest avoids assuming someone has recovered when they did train.
A useful review routine
- Check duration, discipline and the source of the load.
- Compare the content of the session with the objective.
- Look at the last few weeks for that same person.
- Ask about how they felt and their recovery before adjusting what comes next.
If they accumulate 300 CT across three concentrated sessions, the context differs from 300 CT spread over six. And a long run with technical descents can leave a muscular demand that the figure sums up poorly.
The calculation, in case you want to go deeper
The general family uses CT = hours × 100 × IR^k. The exponent and adjustments depend on the source. The four examples in the chart set k = 2; swimming by CSS uses another branch. CT obtained from RPE has its own normalisation.
When signals and RPE are missing, the estimate by documented duration uses approximately 49 CT per hour. That reference doesn't prove the effort was moderate: the estimated-load label must be kept. Nor is it equivalent to having measured an IR of 0.70.
It's not advisable to apply the average intensity of a whole session to any interval training: aggregation and weighting matter. The product detail must stay consistent between planning and execution.
The idea worth passing on to the athlete
"Load came out higher than planned. Let's see whether you did more time, more intensity, or whether the data we calculated it from changed. Then we'll decide how it fits into your week."
What this explanation is based on
- Bourdon PC et al. (2017). Monitoring Athlete Training Loads: Consensus Statement. Framework for monitoring loads.
The references support concepts and limits. The numerical examples on this page are educational; they are not results from those studies.