By JuanPa, creator of TrainingForever · Updated 4 November 2026
Two weeks can have the same training time and a very different intensity distribution. Time in zones lets you see where the minutes have accumulated.
Its value lies in contrasting the intention of the training with the recorded distribution. Before comparing percentages, check which zones and which signal generated them.
A distribution that total minutes don't explain
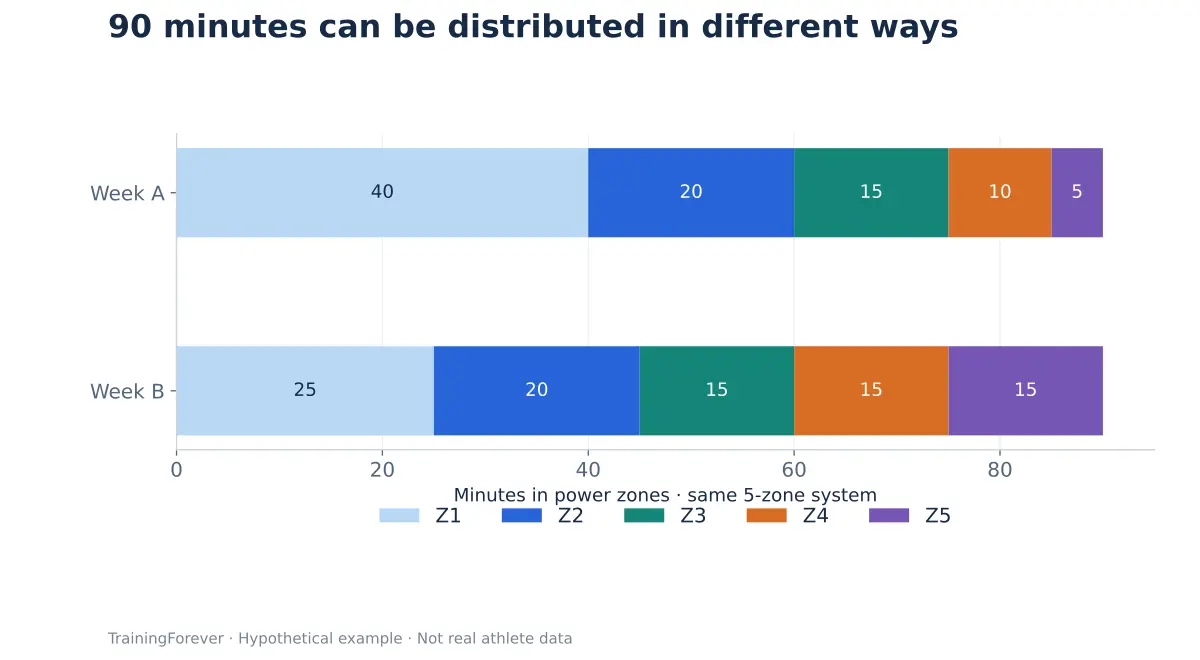
| Week | Z1 | Z2 | Z3 | Z4 | Z5 | Total |
|---|---|---|---|---|---|---|
| A | 40 | 20 | 15 | 10 | 5 | 90 |
| B | 25 | 20 | 15 | 15 | 15 | 90 |
In B there is more time in the upper zones of this system. To know whether that fits, you need the goal for that week and the rest of the plan.
Case: lots of easy runs that always finish strong
The coach proposes easy sessions and one quality session. When reviewing several weeks, they notice that the ends of the easy runs are gradually turning into more intense efforts.
The distribution helps to locate the change. Then it's worth opening the sessions: are they unavoidable climbs, group accelerations, outdated zones or a tendency to race every easy run?
The decision may be to organise the easy outings better. There's no need to add another intense session just because the planned one doesn't look hard enough on the calendar.
Why HR, power and pace don't always match
HR describes an internal response and takes time to react. Power changes immediately with the cyclist's output. Pace depends on speed, gradient and conditions.
In a short repetition, power may be in a high zone while HR is still rising. In the heat, HR may stay high at a lower external output. These are signal differences to interpret, not to correct by forcing the percentages to match.
Four checks before comparing
- Same zone system and signal.
- Thresholds current and consistent with the period.
- Valid duration and sufficient data coverage.
- Sessions and weeks with a comparable purpose.
A Z2 in a five-zone system is not necessarily equivalent to zone 2 in a three-zone physiological model. The label number isn't enough.
What the calculation does
The valid time of the samples falling in each interval is added up. If there are relevant gaps or an incomplete signal, the interpretable total may not match the full watch duration.
When presenting percentages, state the denominator: time with valid data, moving time or total duration. An 80% without that reference can be misleading.
What it means for training
It helps to distribute stimuli and review their execution. Research on intensity distribution does not turn a specific percentage into a recipe for every sport, season phase and level. The useful reading is whether the combination serves the goal and how the person responds.
What this explanation is based on
- Seiler S (2010). What is best practice for training intensity and duration distribution in endurance athletes? Review of intensity distribution in endurance sports.
The references support concepts and limits. The numerical examples on this page are educational; they are not results from those studies.