By JuanPa, creator of TrainingForever · Updated 4 November 2026
An hour at a steady 200 W doesn't have the same profile as an hour alternating easy and hard sections, even though both end with an average of 200 W. PP makes the changes more visible than the average smooths out.
It helps complete the reading of a cycling ride; it is still an estimate calculated from power. It does not directly measure fatigue or oxygen consumption.
Look at the two sessions first
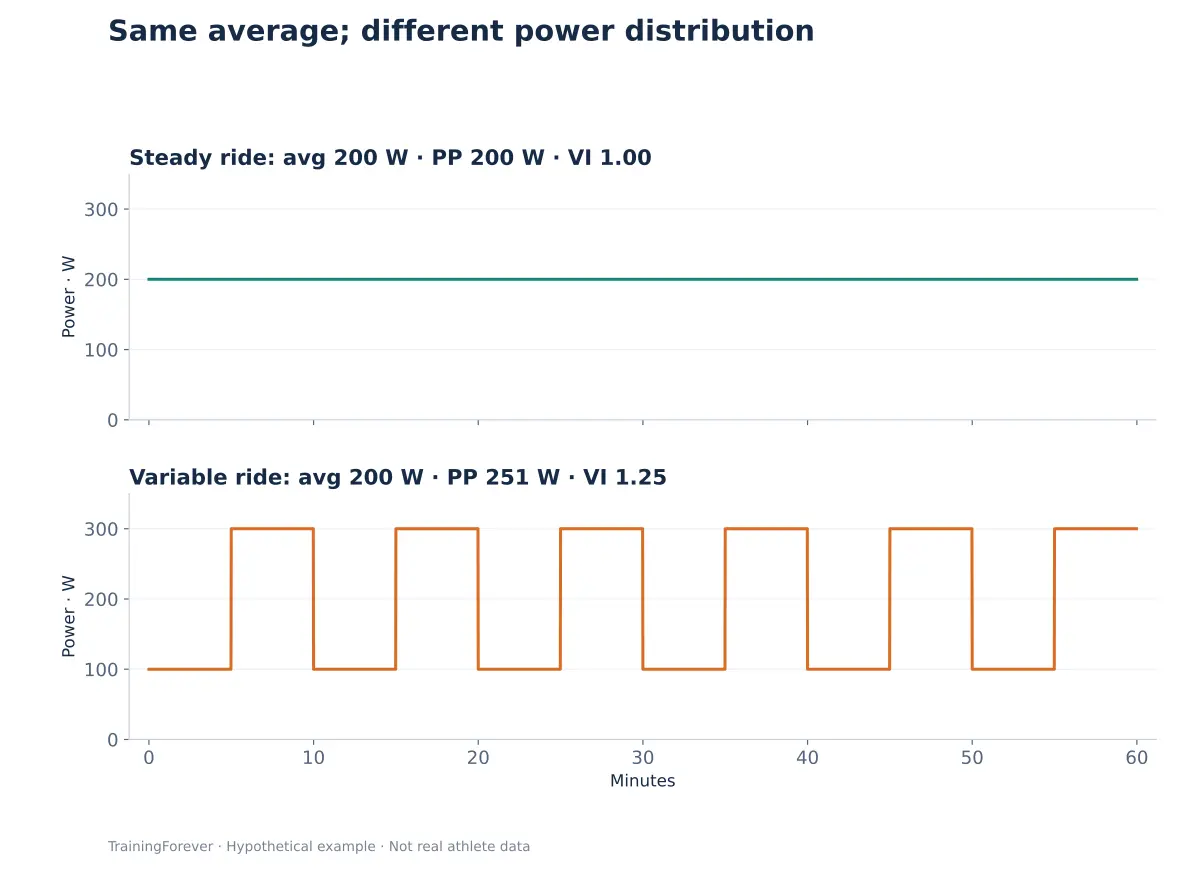
These are not two "equivalent" sessions. They show two distributions of the same average to illustrate what information is lost when you look only at the average.
Case: the group ride that stopped being easy
Diego's goal was an easy ride. He comes back with a reasonable average power, but the file contains repeated accelerations to close gaps and get over short climbs.
The gap between average and PP invites you to open up the training. How long did those changes last? Did they exceed the planned intensity? How did he finish the last repetitions or the next day's training?
If the goal was to practise pace changes, that variability might be intended. If easy continuity was the aim, it's worth reviewing the choice of route or group.
What to add to PP
| Data point | Question it helps answer |
|---|---|
| Average power | What average output did the ride record? |
| PP | How much does the summary change when variability is weighted? |
| VI | What is the relationship between PP and average? |
| Time in Zones | Where were the minutes distributed? |
| Repetitions and recoveries | Was the planned session executed? |
PP does not replace the best 20-minute average or an FTP test. A single value for the whole ride doesn't describe the quality of each interval either.
How to compare it from one week to the next
Compare sessions of the same type, similar duration and context. A higher PP during a ride that was meant to be easy may indicate more intensity, not an improvement.
Before interpreting a large difference, check calibration, interruptions and power meter spikes. Valid zero-power values while moving have meaning; they shouldn't disappear just to improve the summary.
What the calculation does
TrainingForever's documentation describes a 30-second moving average, followed by a fourth-power weighting and a final fourth root. For its PP values it requires cycling with power, sufficient continuity and a minimum duration of 20 minutes.
Those requirements are the product's. They don't turn PP into an individual physiological measure validated for any session. If they aren't met, "no data" communicates the situation better than a zero.
A concrete application
After several comparable easy rides, check whether Diego can meet the same purpose with fewer involuntary accelerations. The success criterion would be executing the session better and arriving in good shape for the next stimuli. Lowering or raising PP on its own is not the goal.
What this explanation is based on
- TrainingPeaks. Normalized Power. Technical documentation from the developer of the reference indicator. Technical source; it does not constitute independent scientific validation of the algorithm.
- Kolsung EB, Ettema G, Skovereng K (2020). Physiological Response to Cycling With Variable Versus Constant Power Output. Studies the response to variable and constant power. It does not validate PP as an exact equivalence of individual cost.
The references support concepts and limits. The numerical examples on this page are educational; they are not results from those studies.