By JuanPa, creator of TrainingForever · Updated 4 November 2026
A cyclist can do a steady, demanding session, or a variable session with plenty of easy time. VI describes how far Weighted Power departs from average power. To know the intensity you need more information.
Use it to ask whether the distribution of effort matches the session. A low VI is not a pass mark and a high one is not automatically a mistake.
A number that makes more sense when you see the file
Three contexts with different interpretations
| Context | What is worth reviewing |
|---|---|
| Easy, continuous endurance ride | Whether accelerations altered the objective |
| Intensity intervals | Whether the changes correspond to blocks and recoveries |
| Racing with attacks or short climbs | Whether the variability responds to the demands of the event |
Variability is expected in intervals. Trying to reduce it at any cost could make the session worse. In a continuous endurance ride, on the other hand, it is worth understanding why the profile contains so many peaks.
Case: the training before a key session
Clara was supposed to ride easy on Saturday to arrive on Sunday with margin. Her average watts look appropriate, but VI and the chart show repeated changes.
Before removing her Sunday session, talk to her and review the duration of the peaks, the intensity relative to her FTP and how she felt. VI helps to find the pattern; it does not on its own quantify how long she will take to recover.
The conversation may end in an organisational decision: choose another route or ride alone when the purpose is continuity. It is not always necessary to change the whole plan.
How it is calculated
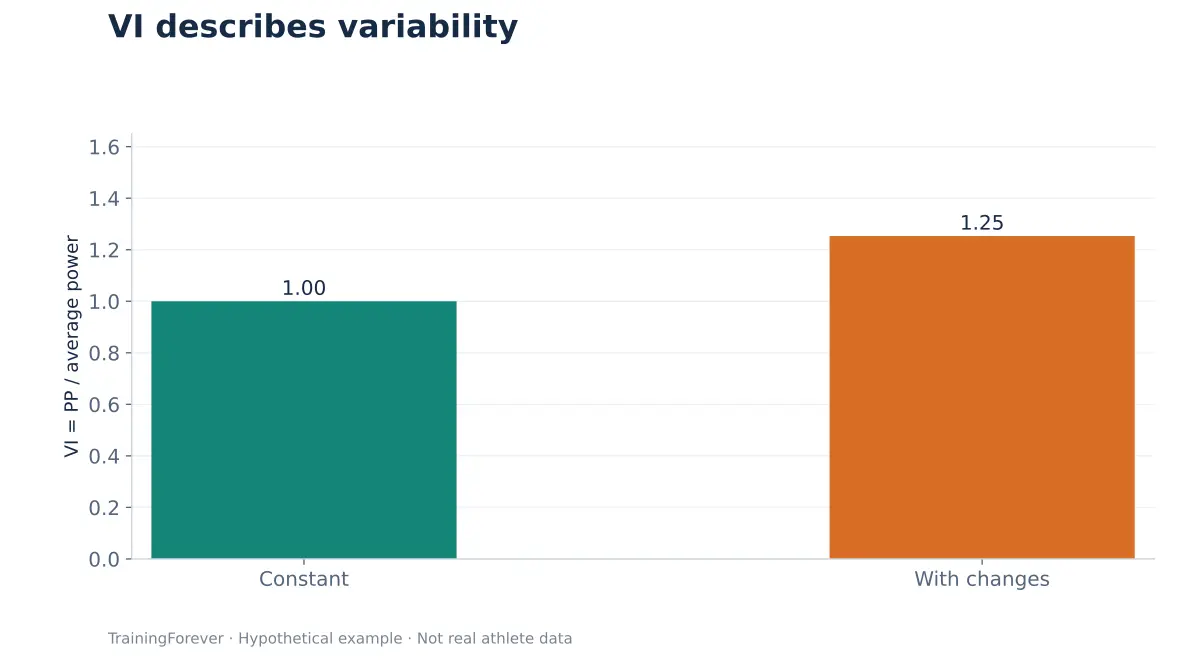
VI = Weighted Power / average power.
With PP 200 W and an average of 200 W, VI is 1.00. With PP of approximately 251 W and an average of 200 W, it is around 1.25.
A value close to 1 usually appears in continuous efforts with adequate recordings. References such as 1.05 describe a practical criterion of steadiness; they are not universal limits of good execution.
Mistakes that change the reading
- Comparing a flat time trial with a mountain event.
- Concluding that a higher VI always implies a higher Total Load (CT).
- Using VI from very short intervals as if the algorithm summarised any duration with equal validity.
- Ignoring dropouts or impossible peaks from the power meter.
If two rides by the same cyclist have a similar VI but last one and four hours, the overall demand will be different. Add duration, Relative Intensity (IR), Total Load (CT) and the subsequent response.
What it means at a sporting level
The practical value lies in organising the effort to meet an objective. It can help to study pacing, but it does not decide a race strategy without terrain, tactics and the athlete's abilities.
What this explanation is based on
- TrainingPeaks. Advanced Analysis Metrics. Technical documentation on VI. Defines the index as the ratio between normalized power and average power.
- Kolsung EB, Ettema G, Skovereng K (2020). Physiological Response to Cycling With Variable Versus Constant Power Output. Puts the study of variability in context; it does not establish a universal optimal VI.
The references support concepts and limits. The numerical examples on this page are educational; they are not results from those studies.