By JuanPa, creator of TrainingForever · Updated 4 November 2026
Load counts how much training has been accumulated. Best efforts show which outputs were recorded over specific durations. The two questions complement each other.
A best efforts curve describes what was observed in the period. It does not guarantee that maximum capacity was tested at every duration.
How to read the curve
For each duration, the best valid average within the activities is sought. For power, the highest matters; for pace, the lowest time per kilometre. Each point may come from a different day.
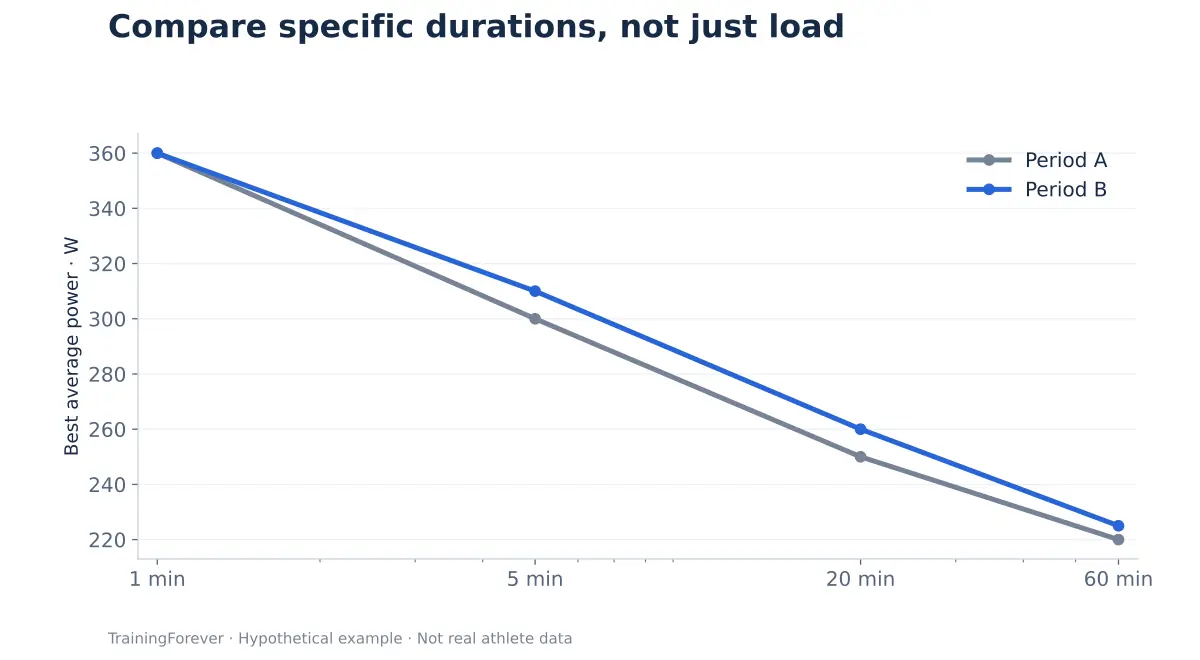
| Duration | Period A | Period B | Observed change |
|---|---|---|---|
| 1 min | 360 W | 360 W | No change |
| 5 min | 300 W | 310 W | +10 W |
| 20 min | 250 W | 260 W | +10 W |
| 60 min | 220 W | 225 W | +5 W |
Period B contains better records at some durations. To talk about changes in capacity, it matters to know whether there were comparable opportunities to express it.
Case: more load and an apparently worse curve
David finishes a block with more CT, but does not improve his best 20 minutes. He has done a fair amount of easy work and no sustained intense session.
The curve does not prove that he has lost performance. It simply does not contain a comparable effort that would allow this to be checked. If that duration matters for his goal, the coach can schedule an appropriate assessment when it makes sense within the plan.
The reverse also happens: a one-minute record does not confirm that he is ready for a multi-hour event. The result has value at the duration and in the context in which it was observed.
How to compare periods
- Use windows of similar length and check the number of activities.
- Check that there were relevant efforts at the durations of interest.
- Keep device and conditions as comparable as possible.
- For running, add terrain, gradient and wind.
A rolling window can lose a record because the activity fell outside the period. The curve drops even if the athlete has not got worse that day.
Mistakes worth avoiding
Do not automatically turn the best 20-minute data point into an individual FTP. Nor should you fit a reliable critical power from points that were not adequate efforts for that purpose.
For heart rate, a higher value does not equal better performance. And very short pace windows can be especially sensitive to GPS. The best peak in the file may be an artefact.
What sporting sense it makes
The curve helps to choose which duration to observe and to check the specificity of training. If you are preparing for a long event, what matters is what is sustained for a long time and under fatigue, as well as fresh and short results.
The chart invites a specific question: "Do we have comparable evidence that he can now produce more in what his event demands?" That approach avoids confusing training accumulation with demonstrated improvement.
What this explanation is based on
- Jones AM et al. (2010). Critical power: implications for determination of VO₂max and exercise tolerance. Power-duration framework. A descriptive curve is not the same as a validated critical power fit.
- Maunder E et al. (2021). The Importance of Durability in the Physiological Profiling of Endurance Athletes. Context for distinguishing fresh performance and performance during prolonged exercise.
The references support concepts and limits. The numerical examples on this page are educational; they are not results from those studies.