By JuanPa, creator of TrainingForever · Updated 4 November 2026
A figure called Performance Potential invites you to think about your race time next Sunday. To use it well, you need to know its scope: in TrainingForever it is a combination of two load indices.
PR does not forecast minutes, watts or placing. It can help visualise the mathematical effect of combining training memory with a lower recent load.
The chart that prevents the most dangerous interpretation
Why it rises during a taper
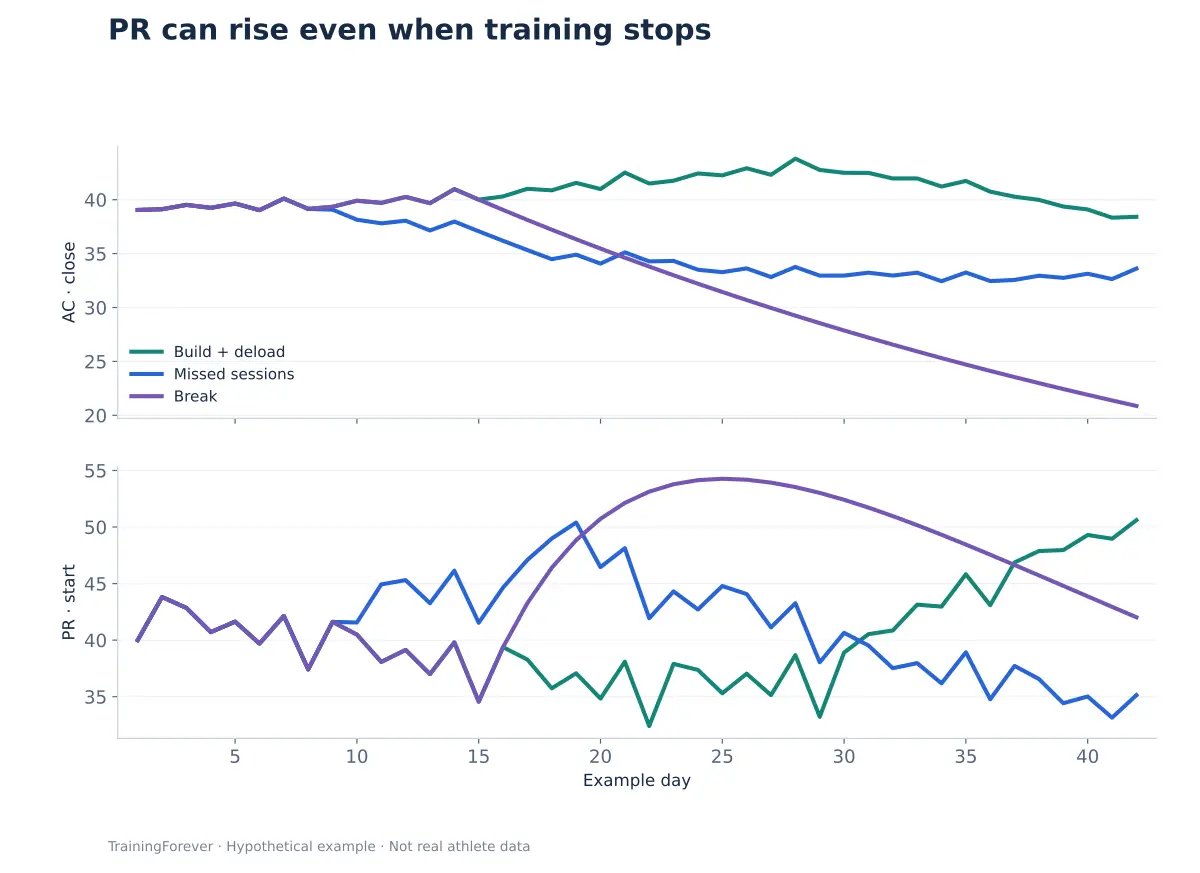
If Acute Fatigue (FA) falls faster than Chronic Adaptation (AC), the combination that forms PR can increase. That is consistent with a taper intended to reduce recent load after adequate preparation.
But the curve only knows Total Load (CT). It does not know whether technique, specific intensity or confidence have been maintained, or whether the athlete is sleeping well or has niggles.
Case: two weeks with less load
In the build scenario, after four weeks Total Load (CT) is reduced from 350 to 210 and 140. PR increases during the taper. The sporting interpretation requires checking that this reduction fits the race and the individual response.
In the layoff scenario, the third and fourth weeks have zero Total Load (CT). Chronic Adaptation (AC) falls from approximately 41 at the end of the second week to 29 at the end of the fourth; even so, PR at the start of the last day of that fourth week is around 54.
There is no contradiction: the fast filter has dropped much further than the slow one. It would be a mistake to translate that 54 into a demonstrated improvement in fitness.
How to back PR up with evidence
| Add this information | What it helps to check |
|---|---|
| Recent key sessions | Whether specific preparation is being maintained |
| Comparable Best Efforts | What performance has been observed |
| RPE and how it feels | How the training is being experienced |
| Reason for the load reduction | Whether it is a taper, lack of time or a break |
An athlete with a lower PR can perform better than one with a higher PR. Even within the same person, the number does not replace a sporting assessment.
Optional calculation
PR_today = 2 × AC_yesterday − FA_yesterday = AC_yesterday + DC_today.
It is not a 0 to 100 scale or a percentage of preparation. It can take negative values. It also refers to the start of the day: using end-of-day AC to reconstruct it would produce a different temporal comparison.
The constants belong to the product; the model has not been calibrated here against each user's race times.
What use can it have for the coach
It serves as visual support when reviewing build and taper, provided its dependence on AC and FA is explained. Peaking is judged by the preparation and the response it achieves, not by maximising this index.
A useful way to communicate it would be: "Recent load is coming down. Let's check whether that lets you express the work you've already done."
What this explanation is based on
- Bosquet L et al. (2007). Effects of tapering on performance: a meta-analysis. Studies tapering and performance; it does not validate a numerical PR target.
- Morton RH, Fitz-Clarke JR, Banister EW (1990). Modeling human performance in running. Conceptual background; it does not amount to validating this fixed product combination.
The references support concepts and limits. The numerical examples on this page are educational; they are not results from those studies.