By JuanPa, creator of TrainingForever · Updated 4 November 2026
A cyclist puts out the same watts across several similar sessions, but their average heart rate changes. The relationship between output and heart rate offers a way to track that pattern.
In TrainingForever, "aerobic efficiency" is the name of a field ratio. It is not the same as measuring mechanical efficiency, oxygen consumption or running economy in a lab.
What the metric relates
In cycling it uses Weighted Power (PP) divided by average HR. In running and trail it uses flat-equivalent speed, expressed in metres per minute, divided by average HR.
The units change with the discipline. You should not compare the bike value with the running value, nor use it to rank different athletes against each other.
| Comparable session | PP | Average HR | Ratio |
|---|---|---|---|
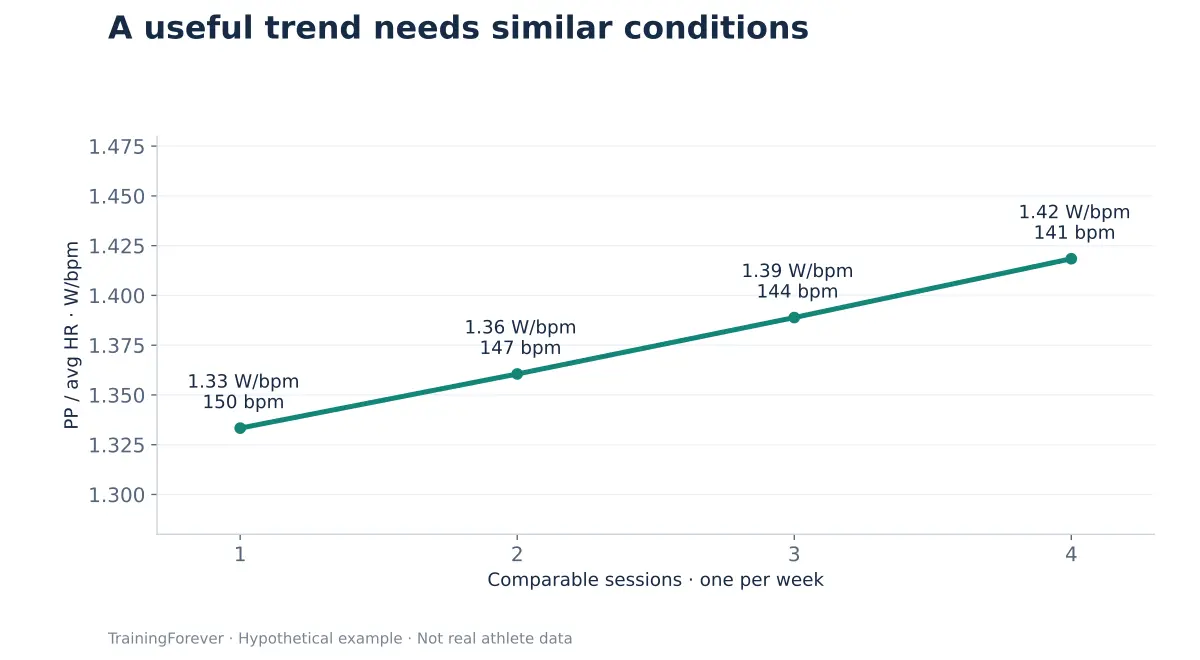
| 1 | 200 W | 150 bpm | 1.33 W/bpm |
| 2 | 200 W | 147 bpm | 1.36 W/bpm |
| 3 | 200 W | 144 bpm | 1.39 W/bpm |
| 4 | 200 W | 141 bpm | 1.42 W/bpm |
Case: a trend worth checking
Over four weeks, Sara repeats a steady block in similar conditions. Power stays the same and heart rate is somewhat lower. If she also keeps feeling good, the pattern is consistent with a favourable response.
But before calling it an improvement, check whether the temperature has dropped, whether the sensor is reading the same, and whether the sessions had the same duration. A single outing with low heart rate does not prove adaptation; it may even be hard to interpret if Sara feels unwell or cannot produce her usual power.
How to design a useful comparison
Pick a stable block that can be repeated without turning every week into a maximal test. Keep discipline, route, duration, warm-up and conditions as consistent as possible. Note any relevant changes.
Look at several sessions, not the single best data point. If the comparison degrades because hot days, technical routes and intervals get mixed together, separating the records helps more than adding decimal places.
What it means when it goes up or down
A higher ratio indicates more recorded output per unit of HR in that summary. On its own it does not identify the cause. A lower one invites you to review the context, especially when the athlete reports more effort at the same pace or power.
The measure should sit alongside observed performance, RPE and recovery. A specific adaptation may show up in a test or key session even if the overall ratio does not change clearly.
Calculation at the end
Bike efficiency = PP / average HR.
Running efficiency = equivalent speed [m/min] / average HR.
Simplicity makes it easy to track, but it does not remove uncertainty. Changes in heart rate that do not come from adaptation are still inside the number.
A better question for the review
"In similar sessions, can they sustain the expected output with a more stable response and feel?" That question connects the chart to practice and avoids chasing a universal efficiency value.
What this explanation is based on
- Joyner MJ, Coyle EF (2008). Endurance exercise performance: the physiology of champions. Describes physiological determinants of performance; it does not validate this product ratio.
The references support concepts and limits. The numerical examples on this page are educational; they are not results from those studies.