By JuanPa, creator of TrainingForever · Updated 4 November 2026
Historical weekly model. This page explains an earlier TrainingForever convention. Its figures are not directly comparable with the daily Evolución curves.
A quotient can show how far one week sits from the average of previous weeks. It is a compact way to describe change, but you also need to look at the two quantities that make it up.
The ratio does not provide an injury probability or a guarantee of tolerance. Coaching decisions require knowing the training and the athlete's response.
The same ratio can hide different changes
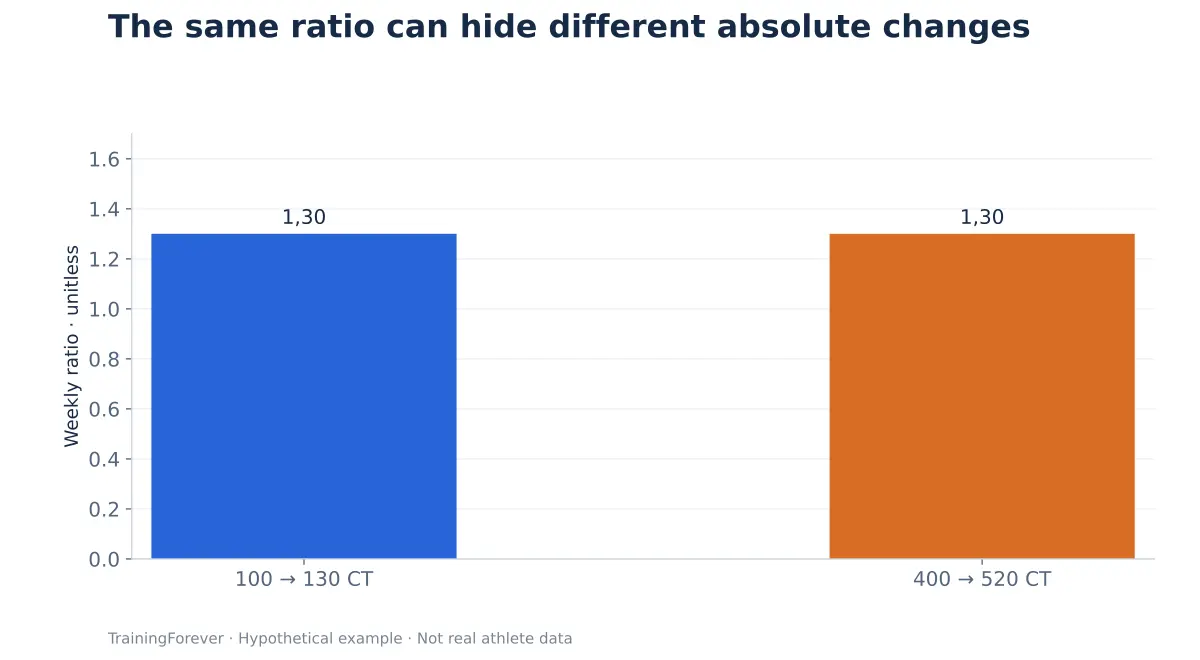
A value of 1.30 means 30% above the denominator used. It does not mean 30% more fatigue or a 30% risk.
How it was calculated
Ratio = CT this week / average CT of the previous four weeks.
The current week is not included in that previous average. If the denominator is zero, there is no defined ratio; if it is very small, a modest change can produce a huge quotient.
In older documentation it was also called "load slope". It is not the daily Progression Rate of AC: they have a different formula and a different unit.
Case: returning after a break
After several weeks of very little activity, an already modest return can generate a large ratio. The quotient describes its relationship to a small base; it does not determine which session should be removed.
The coach needs to review the break, the planned content and what the person can do now. Looking only at the colour of the ratio could lead to inconsistent decisions.
What the 1.30 reference means
The old generator used that limit as a conservative internal rule. It should not be published as a scientific boundary between safe and dangerous load.
Critical research on acute/chronic ratios warns that their causal use to reduce injuries is not established. Moreover, different ratios can share problems without being exactly the same metric.
How to make use of the comparison
If a significant change appears, ask what produced it: duration, intensity, elevation gain, return after a break or incomplete data. Then compare it with execution and how it felt.
The ratio can open that review; it does not resolve it.
What this explanation is based on
- Impellizzeri FM et al. (2020). Acute:Chronic Workload Ratio: Conceptual Issues and Fundamental Pitfalls. Analyses conceptual and statistical problems of the ACWR; it does not validate this historical ratio as a predictor.
The references support concepts and limits. The numerical examples on this page are educational; they are not results from those studies.