By JuanPa, creator of TrainingForever · Updated 4 November 2026
AC can be rising slowly or changing faster than usual. The Progression Rate summarises how far that curve has moved in seven days.
It describes a modelled load ramp. It does not indicate how much the athlete has improved, nor does it calculate injury risk.
How to read the chart
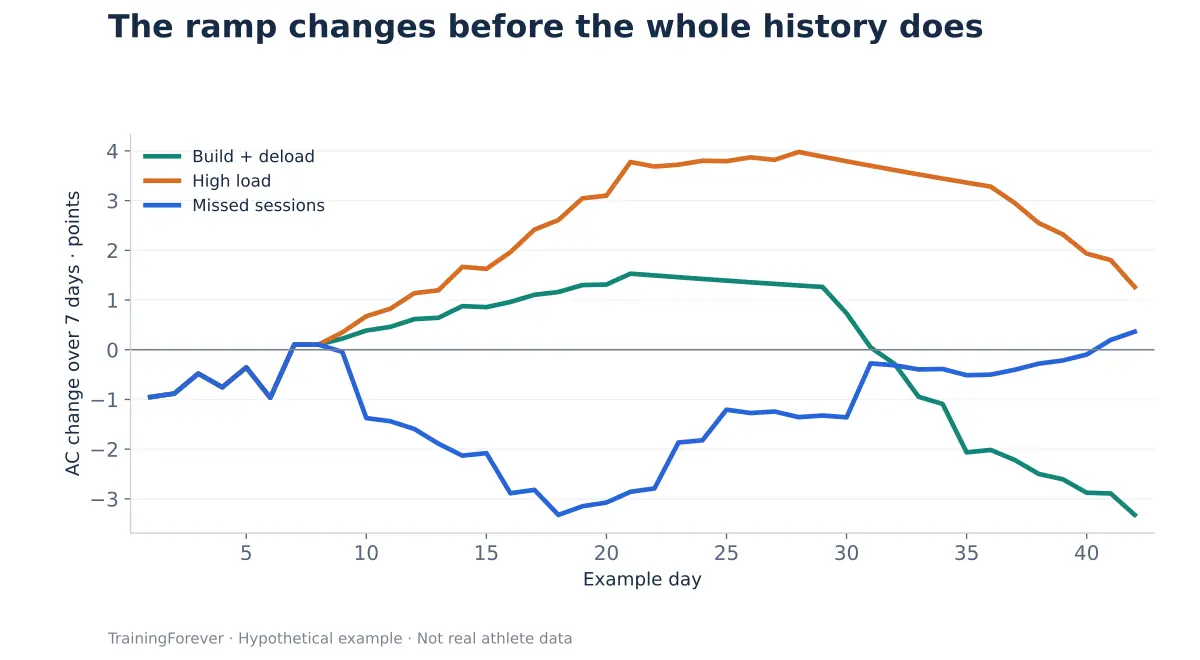
A positive value means AC is higher than seven days ago. A negative one shows a decrease. Close to zero, there is barely any net change between the two moments, even if the sessions in between were different.
Two simple calculations
| AC seven days ago | AC today | Progression Rate |
|---|---|---|
| 40 | 43 | +3 points |
| 40 | 38 | −2 points |
Going from 40 to 43 is also equivalent to a 7.5% relative increase, but that percentage is a different calculation. The documented metric returns +3 points.
Case: load is added without changing many hours
Víctor keeps the same number of sessions and increases the intensity of several of them. His CT rises and, by sustaining it, AC changes faster.
The Progression Rate helps to spot the change without waiting for the whole slow curve to shift a lot. After that, you have to open up the sessions: hours alone do not explain what has changed.
If elevation gain (D+) is also added or training is concentrated before a trip, the content and distribution can matter more than the final number of the ramp.
Case: the ramp turns negative
During a planned deload it can be consistent. If it appears because sessions are being missed repeatedly, it is worth reviewing availability and priorities.
There is no point in always chasing a positive ramp: training includes stable periods and periods of lower load. The sign gains value when related to the point in the season.
What I would ask before adjusting
- Was the rise planned, and what caused it?
- Is it large relative to this same person's history?
- How does he respond in the key sessions?
- Are there errors, duplicates or a change of CT source?
Two athletes with the same ramp do not necessarily tolerate the same plan. Nor can a universal threshold be set from a few examples.
What the calculation does
Progression_today = AC_today − AC_7_days_ago.
It compares daily closes from the same model. To calculate it at the start of a series, enough prior history is needed; a recent entry on the platform may show a stabilisation period or no data.
In this package, the initial condition is known and simulated. That convenience should not be carried over to a new athlete whose history has not been imported.
Its sporting value
It allows you to review whether the plan's rate of change matches the observed response. The decision still rests on continuity, specificity, recovery and performance evolution.
What this explanation is based on
- Impellizzeri FM et al. (2020). Acute:Chronic Workload Ratio: Conceptual Issues and Fundamental Pitfalls. Reference for avoiding turning load ratios into causal predictors of injury.
The references support concepts and limits. The numerical examples on this page are educational; they are not results from those studies.