By JuanPa, creator of TrainingForever · Updated 4 November 2026
Historical weekly model. This page explains an earlier TrainingForever convention. Its figures are not directly comparable with the daily Evolución curves.
If two screens show the same acronym with different figures, start by checking the model and the period. The explanation may be that one view uses the old weekly calculation and the other uses activities from the daily model.
Shared acronyms do not guarantee comparable units. This page helps you recognise the historical model when it appears in an earlier summary or document.
What inputs it used
The model combined weekly hours and elevation gain. It did not rebuild the same load from intensity and activities the way today's daily model does.
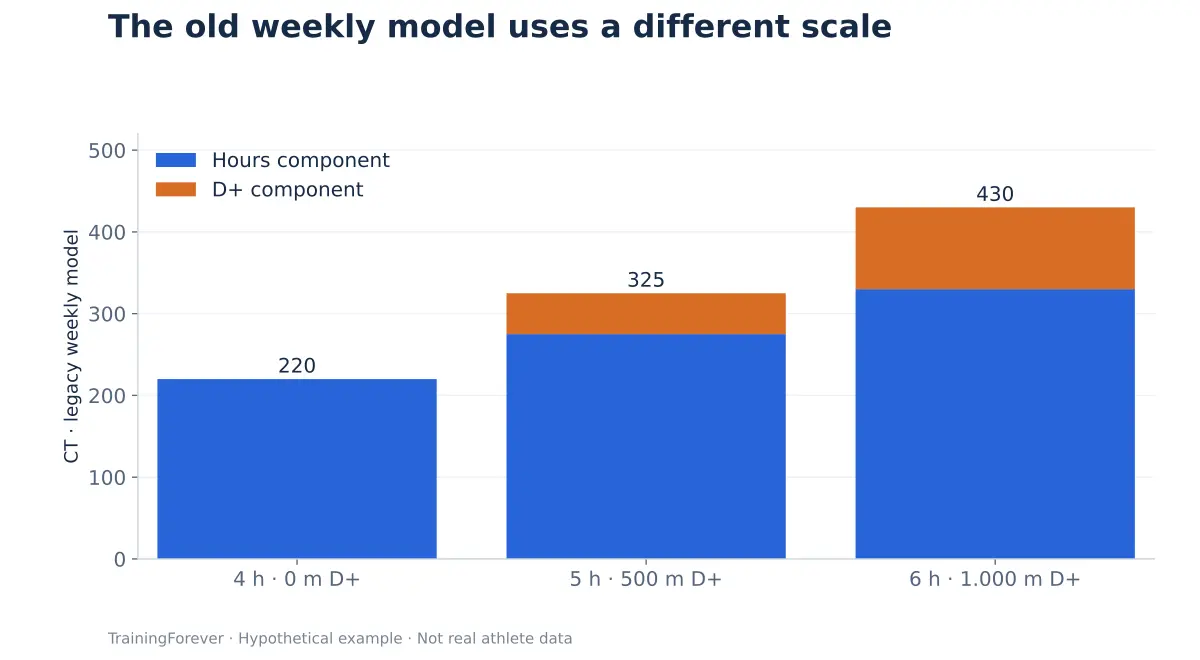
| Week | Hours | D+ | Historical CT |
|---|---|---|---|
| A | 4 | 0 m | 220 |
| B | 5 | 500 m | 325 |
| C | 6 | 1,000 m | 430 |
How its indicators related to each other
| Historical indicator | Definition |
|---|---|
| Weekly CT | 55 × hours + 0.1 × D+ |
| Weekly AC | Average CT of the week and the three before it |
| Weekly FA | CT of that week |
| Weekly DC | Weekly AC minus weekly FA |
| Weekly PR | Twice weekly AC minus weekly FA |
In a CT sequence of 280, 300, 320 and 340, the AC of the fourth week is 310; FA is 340; DC is −30 and PR is 280. These four values are temporally comparable within that model.
What a coach can interpret
The historical reading preserves descriptive information: how much time and elevation gain were scheduled and how they changed relative to nearby weeks. But hours and D+ are not enough to reconstruct intensity, descents or the individual response.
In particular, historical FA is directly the load of the week. It is not the daily filter with a 1/7 coefficient used in the current dashboard.
How to avoid an incorrect comparison
Before exporting or contrasting data, identify the model name, the unit and the period. If you update an old help page, add an explicit "historical weekly model" label.
If you need to compare current trends with earlier records, the best approach is to recalculate with a common method when there is enough data. Do not multiply a figure by seven or apply a fixed proportion to convert between models.
What it means for sport
It can help you understand decisions from an earlier plan. It should not be confused with an independent physiological assessment, nor used to justify universal training limits.
What this explanation is based on
- Banister EW, Calvert TW (1980). Planning for future performance: implications for long term training. General background on training-response models. The weekly coefficients are the product's own conventions.
The references support concepts and limits. The numerical examples on this page are for teaching purposes; they are not results from those studies.