
By JuanPa, creator of TrainingForever · With the experience of Marc Bañuls, coach with more than 15 years of experience · Updated on 16/10/2026
Rapid response: the post-training analysis consists of comparing what was planned with what was done and with how the athlete responded. The useful thing is to combine the external load (pace, power, duration, distance) with the internal load (heart rate, perceived stress or RPE, sensations). The consensus on monitoring recommends using both, and subjective measures are often more sensitive than many objective measures to detect response to training (Bourdon et al., 2017; Saw et al., 2016).
Introduction to post-training data analysis
Post-training data analysis is a key tool for any athlete or coach seeking to optimize sports performance. In a world where technology and sport are increasingly interconnected, the ability to effectively interpret and use data can make the difference between success and stagnation. This section provides an overview of post-training data analysis, highlighting its importance and the objectives it pursues.
Importance of data analysis
The importance of data analysis in sports cannot be underestimated. As tracking devices and fitness applications become more sophisticated, the amount of data available to athletes has grown exponentially. However, mere data accumulation is not enough; it is essential to know how to interpret and use them to improve performance.
- Performance improvement: Data analysis allows to identify patterns and trends in athlete performance. By understanding these patterns, specific adjustments can be made to the training programs to maximize efficiency and effectiveness.
- Injury prevention: By monitoring key metrics, such as training load and recovery, coaches can identify signs of overtraining or fatigue, which helps prevent injuries.
- Customization of training: Each athlete is unique, and data analysis allows you to customize training programs to meet individual needs. This translates into more effective training plans and improved overall performance.
- Objective evaluation: Data provide an objective assessment of performance, eliminating subjective bias that can influence perceptions of progress. This is crucial to making informed decisions about future training.
Objectives of post-training analysis
Post-training data analysis has several key objectives that help guide the performance optimization process. These goals are essential to maximize the benefits of training and ensure that athletes reach their full potential.
- Performance evaluation: One of the main objectives of post-training analysis is to evaluate athlete performance during a training or competition session. This includes the analysis of metrics such as speed, power, heart rate and other relevant variables.
- Identification of improvement areas: By analyzing the data, coaches can identify specific areas where the athlete can improve. This may include technical, tactical or physical aspects of performance.
- Training load monitoring: It is crucial to monitor the training load to ensure that the athlete is not overtraining or undertraining. Data analysis allows the training load to be adjusted to optimize the balance between effort and recovery.
- Planning for future training sessions: Based on the data collected, coaches can plan future training sessions more effectively. This ensures that each session is aligned with the athlete's long-term goals.
- Monitoring progress over time: Post-training data analysis allows athletes and coaches to track progress over time. This is essential to evaluate the effectiveness of training programs and make adjustments as needed.
In short, post-training data analysis is a powerful tool that, when used correctly, can transform the focus of sports training. By understanding and applying the principles of data analysis, athletes and coaches can make more informed decisions, improve performance and achieve their sporting goals more effectively.
Key metrics for analysis
In the area of post-training data analysis, it is essential to focus on certain key metrics that allow us to effectively assess the performance and workload of athletes. These metrics not only give us a quantitative view of the effort made, but also help us adjust and optimize training plans to maximize performance. Next, we will explore three essential metrics: the Total Load (CT), the relative intensity (IR) and time in training zones.
Total Load (CT)
Total Load (CT) is the metric TrainingForever uses to quantify the load of a session. It combines duration and relative intensity (IR) against the athlete's current threshold: power in cycling, pace in running, CSS in swimming, and HR or RPE when no other source is available. One hour at threshold equals 100 CT. It is calculated as:
CT = h · 100 · IR^k
Where:
- \( h \) is the valid time in hours.
- \( IR \) is relative intensity: actual value ÷ current threshold (on the bike, PP ÷ FTP).
- \( k \) is an exponent that depends on the data source (power, pace, CSS, HR or RPE).
relative intensity (IR)
The relative intensity (IR) is a metric that reflects the relative intensity of a training session compared to the athlete's power threshold. It is calculated as:
IR = PP ÷ FTP
Where:
- \( PP \) is the weighted power.
- \( FTP \) is the Functional Threshold Power.
The IR is especially useful for comparing training sessions of different durations and types, providing a clear view of relative intensity. This allows coaches to adjust the training load to avoid overtraining or lack of proper stimulation.
Time in training zones
The time in training zones is a metric that breaks down the total time of a session into different intensity zones, based on the athlete's power or pace threshold. These areas are usually divided into five to seven categories, ranging from active recovery to maximum efforts.
The analysis of time in training zones allows athletes and coaches to identify whether the right time is being spent in each area, in accordance with the specific objectives of the training. For example, a endurance training program may require more time in low intensity areas, while a speed improvement program may focus on high intensity areas.
Detailed analysis of time in areas also helps to identify imbalances in training and adjust future sessions to correct them. In addition, it allows to evaluate the progression of the athlete over time, ensuring that the desired adaptations are being achieved.
In short, the use of metrics such as CT, IR and time in training zones provides a solid basis for post-training data analysis. These metrics not only provide a quantitative view of effort and intensity, but also guide strategic decisions to optimize performance and prevent overtraining. By integrating these metrics into the training planning and review process, athletes and coaches can significantly improve the effectiveness and efficiency of their training programs.
Interpretation of CT and its impact
The Total Load (CT) is a fundamental metric in post-training data analysis, especially for athletes and coaches looking to optimize performance. This metric provides a quantitative view of the stress that a workout imposes on the athlete, allowing adjusting training plans to maximize performance improvement without incurring overtraining.
How to calculate the CT
The calculation of the CT is based on the length of training, the relative intensity, and the athlete's power or heart rate threshold. The basic formula for calculating the CT is:
CT = h · 100 · IR^k (k depends on the data source)
Where:
- Duration is the total time of training in hours.
- weighted power is an estimate of the physiological potency an athlete could maintain for a prolonged period.
- relative intensity (IR) is the relationship between the weighted power and the athlete's Threshold of Power.
Relationship between CT and training load
The CT is a powerful tool for evaluating the training load, as it integrates both duration and intensity into a single metric. A high CT indicates an intense or prolonged training session, while a low CT suggests a lighter or shorter session. This relationship is crucial to understanding how different sessions contribute to the total stress of training and the risk of overtraining.
Example of CT interpretation:
- One hour at threshold equals 100 CT by construction of the scale: that is the reference for reading any other figure.
- Several activities on the same day are added together, and a day without activity contributes 0 CT.
- Compare CT between similar sessions of the same athlete: it is modelled load, not calories or a “good workout” score.
CT-based adjustments
The ability to adjust training plans based on the CT is one of the most significant advantages of this metric. By analyzing the accumulated CT weekly or monthly, coaches can make strategic adjustments to optimize performance and minimize the risk of injury.
Adjustment strategies:
- Periodization of training: Use the CT to plan loading and unloading cycles, ensuring that the athlete does not accumulate excessive stress without proper recovery.
- Identification of stress peaks: Monitor the CT to identify weeks or sessions with unusually high stress, allowing immediate adjustments to avoid overtraining.
- Customization of training: Adapt the training sessions to the individual needs of the athlete, based on their response to stress measured by the CT.
- Assessment of recovery: Use the CT in combination with other recovery metrics to assess whether the athlete is recovering properly between sessions.
Use of IR to assess intensity
The relative intensity (IR) is a crucial metric in post-training analysis that allows you to evaluate the relative intensity of an exercise session. Understanding and properly using the IR can make a significant difference in sport performance optimization. In this section, we will explore in detail what the IR is, how it is calculated, its interpretation in different sports disciplines and how to make intensity adjustments based on this metric.
IR definition and calculation
The relative intensity is a measure that compares the intensity of a training with the reference intensity, usually the functional power threshold (FTP) in cycling or the lactate threshold in other sports. The IR is calculated as the ratio between the weighted power (PP) of a session and the athlete's FTP:
IR = PP ÷ FTP
Where:
- weighted power (PP): It is a measure that reflects the physiological load of a training, taking into account the variations of power during the session.
- FTP (Functional Power Threshold): It is the maximum average power an athlete can maintain for about an hour.
IR interpretation in different sports
The IR is not only applicable to cycling; it is also used in other endurance sports such as racing and swimming, adapting the concept of threshold to the specific metrics of each discipline.
- Cycling: In cycling, the IR is widely used due to the ease of measuring power. An IR between 0.75 and 0.85 usually indicates a endurance training session, while values between 0.85 and 1.0 are typical of threshold or high intensity sessions.
- Race: In the field of the race, the IR can be calculated using the lactate threshold or the pace of the race instead of the FTP. Interpretation remains similar, helping brokers adjust their sessions to improve efficiency and resilience.
- Swimming: In swimming, the IR can be based on the swimming speed threshold. Although intensity measurement is more complex due to water endurance and technique, IR provides a valuable guide to structure effective training.
IR-based intensity adjustments
IR analysis allows coaches and athletes to make precise adjustments to training planning. Below are some strategies to adjust intensity based on IR:
- Planning the training load: Using the IR to balance high and low intensity sessions is essential to avoid overtraining. For example, after a session with a high IR, it is advisable to schedule a recovery day or a low intensity session.
- Optimising performance in skills: In the context of a competition, IR can help athletes manage their effort. Keeping an IR close to 1.0 in endurance events can be a strategy to maximize performance without prematurely exhausting energy reserves.
- Assessment of progress: Comparing the IR of similar sessions over time can provide a clear view of the athlete's progress. An increase in IR for the same session indicates an improvement in working capacity at the same level of perceived effort.
- Adaptation to specific conditions: In outdoor sports, factors such as climate or terrain can affect perceived intensity. Adjusting the IR taking into account these variables helps maintain consistency in training.
In short, the relative intensity is a powerful tool for evaluating and adjusting the intensity of training. Its correct application can lead to significant improvements in sports performance, provided that it is consistently integrated into a well-structured training program.
Time analysis in training zones
Time analysis in training zones is an essential component to optimize sports performance. Understanding how time is distributed in different areas of intensity allows athletes and coaches to adjust training loads more accurately and effectively. In this section, we will explore the definition of training zones, the importance of monitoring time in each of them, and how to make adjustments based on these data.
Definition of training zones
Training areas are intensity ranges that are used to categorize physical exertion during an exercise session. These zones are generally defined by the percentage of the maximum heart rate (CHF), the lactate threshold or the maximum achieved power. Although classifications may vary slightly depending on the sport and methodology used, five to seven training zones are commonly recognized. A general description of these areas is given below:
- Zone 1: Active recovery, less than 60% of FCM.
- Zone 2: Aerobic endurance, 60-70% FCM.
- Zone 3: Aerobic threshold, 70-80% of FCM.
- Zone 4: Anaerobic threshold, 80-90% of FCM.
- Zone 5: Anaerobic capacity, 90-100% FCM.
- Additional areas: In some models, zones 6 and 7 are included for maximum and supra-maximum stress.
These zones allow athletes to structure their workouts so that they focus on developing different physiological capabilities, such as aerobic endurance, anaerobic potency, and speed.
Importance of time in each area
The time an athlete spends in each training area has a significant impact on his physiological adaptation and thus on his performance. Here are some reasons why monitoring time in each area is crucial:
- Specific adaptations: Each training area is designed to cause specific physiological adaptations. For example, spending more time in Zone 2 improves aerobic efficiency and fat oxidation capacity, while training in Zone 4 may increase the lactate threshold.
- Prevention of overtraining: An imbalance in time spent in different areas can lead to overtraining. For example, spending too much time in high intensity areas without adequate recovery can result in chronic fatigue and decreasing performance.
- Performance optimization: By adjusting time in each area, athletes can maximize their performance by making sure they are developing the capabilities necessary for their specific goals, whether it is improving endurance, speed, or power.
- Assessment of progress: Monitoring time in training zones allows athletes and coaches to evaluate progress over time and make necessary adjustments to the training plan.
Time-based adjustments in areas
Once time has been collected and analysed in training zones, adjustments to the training plan can be made to optimize performance. Here are some strategies to adjust time in areas:
- Balance training load: If excessive time is detected in high intensity areas, it may be necessary to increase time in recovery and endurance areas to avoid overtraining and promote adequate recovery.
- Focus on specific weaknesses: If an athlete needs to improve in a specific capacity, such as the anaerobic threshold, time in Zone 4 can be increased while time is reduced in other areas.
- Periodization of training: Incorporating training cycles that vary time in each area over weeks or months can help maximize physiological adaptations and avoid stagnation.
- Continuous monitoring and dynamic settings: Using data analysis tools to monitor time in real-time zones allows dynamic adjustments to the training plan, ensuring that it remains aligned with the athlete's goals.
Good practices
In the area of post-training data analysis, adopting good practices is essential to maximize performance and obtain valuable insights. Some of the best practices to ensure that data analysis is accurate, efficient and useful for decision-making are detailed below.
Accurate data collection
Accuracy in data collection is the fundamental pillar for effective analysis. Without accurate data, any conclusions or adjustments based on analysis could be wrong. Here are some recommendations to ensure the quality of the data collected:
- Use of reliable devices: It is crucial to use measuring devices that are accurate and well calibrated. This includes heart rate monitors, power meters and activity tracking applications that are recognized for their reliability.
- Consistency in collection: Maintaining a consistent methodology for data collection is vital. This means recording data under the same conditions and with the same frequency. For example, if heart rate is measured, it should be done under the same environmental conditions and at the same time of day to minimize variations.
- Regular verification of devices: Technological devices can be decalibrated over time. It is advisable to carry out periodic checks to ensure that the devices are working properly and that the data collected are accurate.
- Recording of contextual variables: In addition to quantitative data, it is important to record qualitative variables that can influence performance, such as mood, sleep quality and climatic conditions. These factors can provide additional context that is crucial for interpreting the data correctly.
Use of analysis tools
The use of appropriate analysis tools is essential to process and understand the data collected. These tools not only facilitate analysis, but can also offer visualizations that help identify patterns and trends.
- Selection of specialized software: There are multiple software platforms designed specifically for training data analysis, such as TrainingPeaks, Strava and Garmin Connect. These tools offer advanced features for the analysis of specific metrics such as load and intensity.
- Process automation: Harnessing the automation capabilities of these tools can save time and reduce human errors. For example, setting up automatic alerts for when certain metrics exceed the established thresholds can be very useful for making quick decisions.
- Data integration: Many tools allow data integration of different devices and platforms, providing a holistic view of performance. Make sure that the selected tools are compatible with the devices you use to maximize their effectiveness.
- Continuing training: As analysis tools are constantly evolving, it is important to keep up to date with new functionalities and best practices. Participating in webinars, online courses, and user forums can be beneficial in improving analytic skills.
Regular review of results
Regular review of results is crucial for adjusting strategies and improving performance over time. Here are some best practices for effective reviews:
- Establishment of a review schedule: Defining a regular calendar to review the data is essential. This can be weekly, monthly or quarterly, depending on specific objectives and data availability.
- Comparative analysis: Comparing current data with historical data can provide insights into progress and areas requiring attention. This may include comparing metrics such as CT and IR over different training periods.
- Evaluation of objectives: During each review, it is important to assess whether the objectives set are being met. If they are not being achieved, it is necessary to identify the causes and adjust the training strategies accordingly.
- Documentation of findings: Keeping a detailed record of the findings and decisions made during each review is essential. This not only helps keep track of progress, but also facilitates pattern identification over time.
The implementation of these good practices not only improves the quality of post-training data analysis, but also provides a solid basis for informed decision-making. By following these recommendations, athletes and coaches can optimize their training strategies and maximize performance.
Adopting these good practices in post-training data analysis is an essential step for any athlete or coach seeking to improve performance in a systematic and data-based manner. With accurate data collection, effective use of analysis tools and periodic review of results, significant improvements in sports performance can be achieved. To move from the analysis of each session to the vision of weeks and months, see the monitoring of sporting performance.
Common errors
In the post-training data analysis process, it is crucial to be aware of common errors that may arise and how to avoid them. These errors can lead to incorrect interpretations and, ultimately, suboptimal training decisions. Below are some of the most frequent errors and how they can affect data analysis.
Incorrect interpretation of metrics
One of the most common errors when analyzing post-training data is the incorrect interpretation of metrics. Metrics such as Total Load (CT) and relative intensity (IR) are powerful tools, but their misunderstanding may lead to erroneous conclusions.
For example, a high CT does not always indicate effective training. It may reflect an excessive burden which, if not properly managed, could lead to overtraining. Similarly, a low IR does not necessarily mean that the training was ineffective; it could be part of a planned active recovery strategy.
To avoid these mistakes, it is essential:
- Educate continuously: Stay up to date with literature and guides on how to correctly interpret metrics.
- Consultation with experts: If you have doubts, look for the opinion of experienced data analysts or coaches.
- Use multiple metrics: Do not base yourself on a single metric to evaluate performance. It uses a holistic approach that considers several metrics and contextual factors.
Ignoring the context of training
Another significant error is to ignore the context in which the trainings were conducted. Performance metrics should not be analyzed in the vacuum; they should be considered together with factors such as climatic conditions, athlete's physical and mental state, and specific training objectives.
For example, training in adverse weather conditions may show lower performance metrics, but this does not necessarily indicate poor performance. Similarly, an athlete who is in a recovery cycle can show lower intensity metrics, which is expected and desired.
To mitigate this error:
- Record the context: Keeps a detailed record of the external conditions and factors that may have influenced training.
- Analyzes long-term trends: Observe how metrics change over time instead of focusing only on data from an individual session.
- Consider the athlete's condition: Incorporates assessments of the athlete's physical and mental state in data analysis.
Data overload
Data overload is an increasingly common problem due to the amount of information that can be collected with modern technology. Although having access to a large amount of data may seem advantageous, it can lead to paralysis by analysis if it is not properly managed.
To avoid data overload:
- Define your goals: Before starting the analysis, be clear what questions you want to answer and what metrics are most relevant to those objectives.
- Simplify the analysis: Use analysis tools that allow you to filter and visualize the data clearly and concisely.
- Check and adjust: Regularly evaluate what data you are collecting and analyze if they are all needed for your current goals.
Post-training analysis checklist
- Did you do what you planned? Duration, intervals and intensities in relation to the plan.
- How much did it cost? RPE and athlete's comment; HR versus pace or power.
- Are there any alarm signals? Disturbing, abnormally high pulse for effort, repeated bad sensations.
- How does it fit in the week? Accumulated load and rest before the next key session.
- What change? Keep, adjust intensities or move sessions.
"The data tells me what happened; the athlete's comment tells me why. If I just look at graphs, I miss half the training.” — Marc Bañuls, coach with more than 15 years of experience
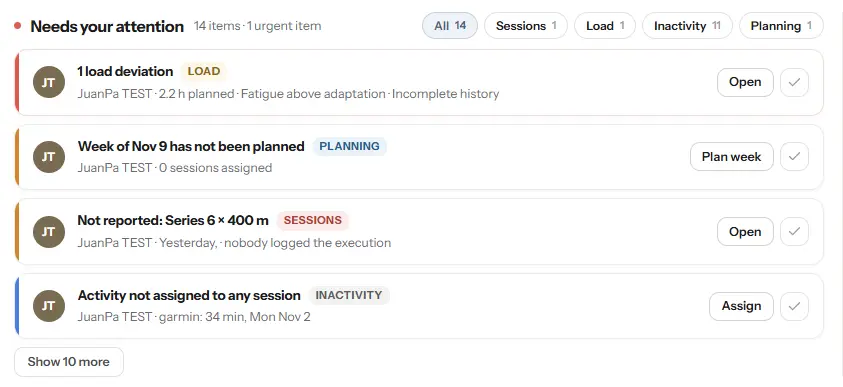
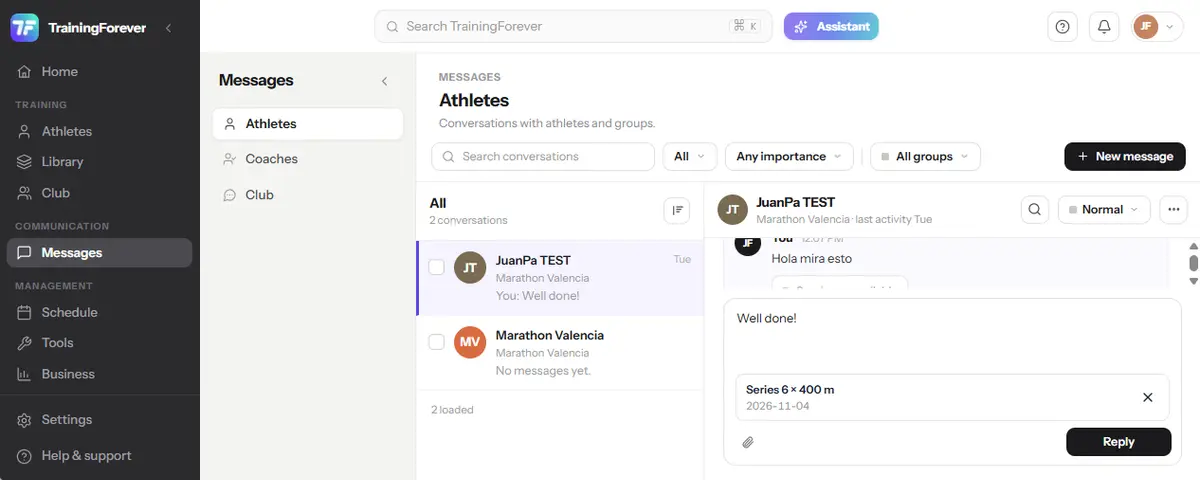
In TrainingForever each activity shows what is planned next to what has been done, with areas, intervals and feedback from the athlete. For accumulated load, look at Chronic Adaptation (AC), Acute Fatigue (FA) and Load Differential (DC).
Frequently Asked Questions
What data should you look at after training?
The planned versus the realized, the external load (pace, power, duration) and the internal load (heart rate, RPE and sensations).
What is the internal and external load?
The external load is the work performed (distance, pace, power). The internal is the body's response to this work (heart rate, perceived effort).
Can I use the RPE if I have a pulser?
Yeah. Perceived effort complements heart rate and helps detect fatigue or evaluate sessions where the pulse is unreliable.
How often should I analyze my data?
The frequency with which you should analyze your post-training data may vary depending on your goals, level of experience and the amount of data you generate. However, there are some general guidelines that can help you establish an effective routine:
- Weekly analysis: For most athletes, a weekly analysis is sufficient to identify trends and make minor adjustments to the training plan. This analysis will allow you to observe how your body responds to different workloads and adjust the intensity or volume of your future sessions.
- Monthly analysis: A more detailed monthly analysis will help you evaluate long-term progress. Here you can check metrics such as the accumulated CT, average IR and time in each training area. This type of analysis is crucial for adjusting your goals in the medium and long term.
- Post-event analysis: After major competitions or events, it is advisable to conduct a thorough analysis to understand what worked well and what aspects need improvement. This analysis will provide valuable information for planning future trainings and competitions.
What tools are recommended for analysis?
There are multiple tools available for post-training data analysis, each with its own features and benefits. Here are some of the most popular and effective:
- Training software: Platforms such as TrainingPeaks, Strava and Garmin Connect provide detailed analysis of your training sessions. These tools allow you to visualize key metrics, such as load, intensity and time in zones, intuitively and accessible.
- Calculation sheets: For those who prefer a more personalized approach, spreadsheets (such as Microsoft Excel or Google Sheets) can be an excellent option. With them, you can create your own graphics and formulas to analyze the data specifically according to your needs.
- Mobile applications: Many mobile applications are designed to provide quick and convenient analytics. Applications such as MyFitnessPal or Endomond allow you to record and analyze data on the go, which is ideal for athletes looking for simplicity and accessibility.
- Measuring devices: Devices such as smart watches, heart rate monitors and cyclocomputers not only record data, but also offer basic analyses directly on the device. These are useful for obtaining immediate information during or just after training.
How can I improve my interpretation of the data?
Improving data interpretation is essential to optimize your performance and make the most of your workouts. Here are some strategies to develop this skill:
- Continuing education: Stay informed about the latest research and trends in sports data analysis. There are numerous online courses, webinars and articles that can help you deepen your understanding of key metrics.
- Expert consultation: Consider working with a sports data coach or analyst. These professionals can offer you an expert perspective and help you interpret the data more accurately. In addition, they can provide you with personalized recommendations based on your specific goals.
- Regular practice: Practice makes the teacher. The more you analyze your data, the more familiar you will be with emerging trends and patterns. Take time regularly to review your data and reflect on what they mean in the context of your training.
- Use of comparatives: Compare your current data with past records to identify improvements or areas that need attention. Comparatives allow you to see progress over time and adjust your training strategies accordingly.
- Feedback and self-evaluation: After each analysis, reflect on the decisions you made based on the data and evaluate their effectiveness. This self-assessment process will help you refine your ability to interpret and make more informed decisions in the future.
Sources
- Bourdon PC, et al. Monitoring athlete training loads: consensus statement. Int J Sports Physiol Perform. 2017;12(Suppl. 2:S2161-70.
- Saw AE, Main LC, Gastin PB. Monitoring the athletic training response: subjective self-reported measures trump commonly used objective measures. Br J Sports Med. 2016;50(5):281-91.
- Halson SL. Monitoring training load to understand fatigue in athletes. Sports Med. 2014;44(Suppl. 2:S139-47.